Public Safety Canada Quarterly Financial Report for the quarter ended December 31, 2024
Table of Contents
- 1.0 Introduction
- 2.0 Highlights of Fiscal Quarter and Fiscal Year-to-Date (YTD) Results
- 3.0 Risks and Uncertainty
- 4.0 Significant Changes in Relation to Operations, Programs and Personnel
- 5.0 Approval by Senior Officials
- 6.0 Statement of Authorities (unaudited)
- 7.0 Departmental budgetary expenditures by Standard Object (unaudited)
1.0 Introduction
This quarterly financial report for the period ending December 31, 2024 has been prepared by management as required by section 65.1 of the Financial Administration Act, in the form and manner prescribed by Treasury Board. The report should be read in conjunction with the Main Estimates.
This report has not been subject to an external audit or review. However, it has been reviewed by the Departmental Audit Committee prior to approval by the Deputy Minister.
Information on the mandate, roles, responsibilities and programs of Public Safety Canada can be found in the 2024-25 Departmental Plan and the 2024-25 Main Estimates.
1.1 Basis of Presentation
This quarterly report has been prepared using an expenditure basis of accounting. The accompanying Statement of Authorities table includes the Department’s spending authorities granted by Parliament, or received from Treasury Board Central Votes, and those used by the Department consistent with the Main Estimates, Supplementary Estimates (A) and Supplementary Estimates (B) for the 2024-25 fiscal year. This report has been prepared using a special purpose financial reporting framework designed to meet the information needs concerning the use of spending authorities.
The authority of Parliament is required before funds can be spent by the Government. Approvals are given in the form of annually approved limits through Appropriation Acts or through legislation in the form of statutory spending authority for specific purposes.
Public Safety Canada uses the full accrual method of accounting to prepare and present its annual departmental financial statements that are part of the departmental performance reporting process. However, the spending authorities voted by Parliament remain on an expenditure basis, as do the expenditures presented in this report.
2.0 Highlights of Fiscal Quarter and Fiscal Year-to-Date (YTD) Results
The following graph provides a comparison of the net budgetary authorities and expenditures as of December 31, 2024 and December 31, 2023 for the Department’s combined:
- Vote 1: Operating Expenditures;
- Vote 5: Grants and Contributions;
- Statutory Votes:
- Employee Benefit Plans; and
- Minister’s Salary and Car Allowance.
The net budgetary authorities are $317.2 million (11.4 percent) lower and expenditures to date are $171.0 million (30.5 percent) higher compared to the same period of previous year. The year-to-date variances are mainly attributed to an increase in payments for natural disasters under the Disaster Financial Assistance Arrangements (DFAA) program despite the program’s reference level authorities being lower this year compared to the previous year.
Comparison of Budgetary Authorities and Quarterly Expenditures as of December 31, 2023 and December 31, 2024 (in thousands of dollars)
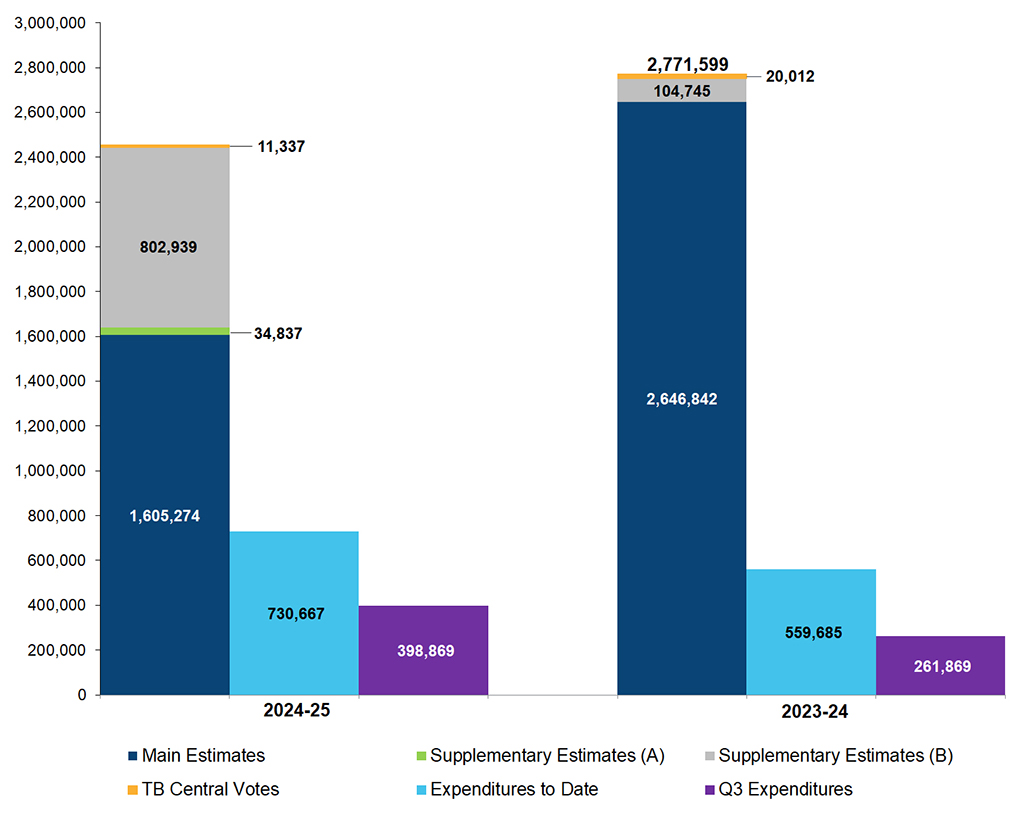
Image description
Starting from the left hand side, the “first” column in the graph indicates that the Department authorities are at $2,454.4 million for fiscal year 2024-25. The year-to-date expenditures of $730.7 million reported at the end of the third quarter of the 2024-25 fiscal year are shown under the “second” column. The expenditures of $398.9 million for the period ended December 31, 2024 (i.e. third quarter) are presented under the “third” column. The “fourth” column in the graph depicts the authorities for fiscal year 2023-24 which were at $2,771.6 million at the end of December 2023. The year-to-date expenditures of $559.7 million reported at the end of the third quarter of the 2023-24 fiscal year are shown under the “fifth” column. The Departments’ actual expenditures incurred in the third quarter of fiscal year 2023-24 were $261.9 million and are shown under the “sixth” column of the graph.
The following graph provides a comparison between the total of Vote 1, Vote 5 and Statutory funding as of December 31, 2024 and December 31, 2023.
Comparison of funding received through Main Estimates, Supplementary Estimates (A), Supplementary Estimates (B) and TB Central Vote transfers as of December 31, 2023 and December 31, 2024 (in thousands of dollars)
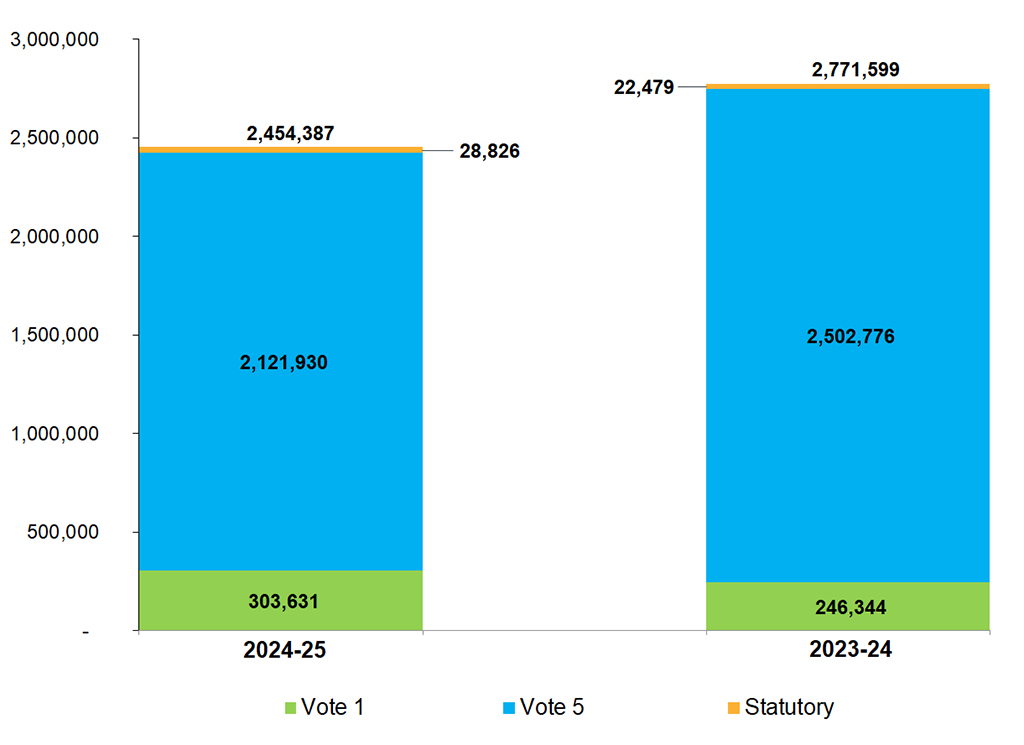
Image description
Starting from the left hand side, the “first” column in the graph indicates that the Department received $2,454.4 million in funding through Main Estimates and Supplementary Estimates “A” and "B" for fiscal year 2024-25. The total includes $303.6 million in Vote 1, $2,121.9 million in Vote 5 and $28.8 million in Statutory funding. The "second" column in the graph depicts the funding received in fiscal year 2023-24 through Main Estimates and Supplementary Estimates “B” which was $2,771.6 million. The total for 2023-24 fiscal year includes $246.3 million in Vote 1, $2,502.8 million in Vote 5 and $22.5 million in Statutory funding.
2.1 Significant Changes to Authorities
For the period ending December 31, 2024, the authorities provided to the Department include Main Estimates, Supplementary Estimates (A), Supplementary Estimates (B) and TB Central Vote transfers. The 2023-24 fiscal year authorities for the same period included the Main Estimates, Supplementary Estimates (B) and TB Central Vote transfers. The Statement of Authorities table (Section 6.0) presents a decrease of $317.2 million (11.4 percent) compared to those of the same period of the previous year (from $2,771.6 million to $2,454.4 million).
Operating Expenditures authorities (Vote1) have increased by $57.3 million (23.3 percent) (from $246.3 million to $303.6 million), which is primarily attributed to:
- An increase of $39.0 million in funding for the Assault Style Firearms Compensation Program (ASFCP) which is primarily attributed to:
- An increase of $22.3 million in new funding in support of the individual phase of the program including the Firearms Compensation Program Web Portal and Case Management System, operational support expenses and a national marketing campaign;
- An increase of $20.1 million in new funding in support of the business phase of the program including the destruction of business owned assault style firearms, establishing and operating a contact center, completion of the Firearms Compensation Program Web Portal and Case Management System and operational support expenses; and
- An increase of $10.7 million in new funding in support of the business phase of the program and primarily related to planning and operational functions.
Offset by the following decreases:
- A decrease of $7.6 million due to the expiry of funding to support the design and development of the Assault Style Firearms Compensation Program; and
- A decrease of $6.5 million due to the expiry of funding for the Firearms Compensation Program Web Portal and Case Management System.
- An increase of $4.6 million in new funding to implement firearms legislation, build policy capacity and modernize firearms-related operational services; and
- An increase of $4.2 million in new funding to strengthen federal policing in Canada.
These increases are primarily offset by the following decrease:
- A decrease of $9.0 million in capital funding required for the relocation and accommodations for the Government Operations Center (GOC) (Budget 2016).
Grants and Contributions (G&C) authorities (Vote 5) have decreased by $380.8 million (15.2 percent) (from $2,502.8 million to $2,121.9 million), which is primarily attributed to:
- A decrease of $374.9 million related to the Disaster Financial Assistance Arrangements (DFAA) program. This is due to a decrease of $100.0 million in funding levels to support the 2021 natural disasters in British-Columbia, as well as a decrease of $274.9 million in funding levels required for fiscal year 2024-25; and
- A decrease of $21.6 million related to the Memorial Grant Program for First Responders due to a fluctuation in funding levels required for fiscal year 2024-25. In fiscal year 2023-24, the program received additional funding to eliminate the backlog of applications and to accommodate growth in the program, however a large portion of the funding was not spent and is anticipated to be fully transferred for use in future fiscal years.
These decreases are primarily offset by the following increases:
- An increase of $23.5 million in funding for the Assault Style Firearms Compensation Program (ASFCP) which is primarily attributable to:
- An increase of $13.7 million in new funding to advance the collection and destruction of business owned banned assault style firearms and to establish a compensation program; and
- An increase of $9.7 million in new funding for the Assault Style Compensation Program for the collection and destruction of individually-owned assault-style Firearms.
Budgetary Statutory authorities have increased by $6.3 million (28.2 percent) in fiscal year 2024-25 primarily attributable to the Employee Benefits Plan associated with new salary funding received in the Main Estimates, Supplementary Estimates (A) and Supplementary Estimates (B).
2.2 Significant Variances from Previous Year Expenditures
Year-to-Date Expenditures
For the period ending December 31, 2024, the Departmental Budgetary Expenditures by Standard Object table (Section 7.0) presents an increase of $171.0 million (30.5 percent) in Public Safety’s year-to-date (YTD) expenditures compared to the previous year (from $559.7 million to $730.7 million). This increase is primarily attributed to:
- An increase of $87.9 million in support of payments related to natural disasters for the Disaster Financial Assistance Arrangements (DFAA) program despite reference levels for this program being lower this year when compared to the previous year. Furthermore, the forecast for this program is based on the departmental fall 2024 semi-annual accounting exercise and includes Orders in Council (OiC) that are pending approval. These forecasts are sometimes either overstated or understated at the onset with refined estimates forthcoming from provinces and territories (PTs) as damages are assessed and remediation requirements are determined. Additionally, a PT may unexpectedly change their payment request (either timing or payment);
- An increase of $34.4 million in support of payments for the First Nations and Inuit Policing Program; and
- An increase of $32.2 million in support of payments for the Initiative to Take Action Against Gun and Gang Violence.
Third Quarter Expenditures
Compared to the previous year, expenditures used during the quarter ended December 31, 2024 have increased by $137.0 million (52.3 percent) (from $261.9 million to $398.9 million) as reflected in the Departmental Budgetary Expenditures by Standard Object table (Section 7.0).
- Operating expenditures (Vote 1) have increased by $4.5 million (7.4 percent) primarily attributed to:
- An increase of $7.5 million in spending primarily attributed to professional management consultants and legal services for the Assault Style Firearms Compensation Program (ASFCP); and
- Offset by a decrease of $4.7 million in personnel expenditures, primarily attributed to a decrease in retroactive pay for the salary funding to cover compensation adjustments associated with concluded collective agreements, and updated terms and conditions of employment for the 2023-24 fiscal year.
Transfer payment expenditures (Vote 5) have increased by $132.0 million (67.5 percent) primarily attributable to:
- An increase of $120.8 million due to the timing of payments for the Disaster Financial Assistance Arrangements (DFAA) program;
- An increase of $13.0 million due to the timing of payments for the First Nations and Inuit Policing Program; and
- An increase of $9.6 million due to the timing of payments for supporting the Canadian Red Cross’s Urgent Relief Efforts Related to COVID-19, Floods and Wildfires.
3.0 Risks and Uncertainty
Disaster Financial Assistance Arrangements
The Disaster Financial Assistance Arrangements (DFAA) contribution program presents a greater level of uncertainty than other PS grants and contributions programs given that it represents a significant portion of the PS budget and that it is subject to unforeseen events. The DFAA contribution program was established in 1970 to provide a consistent and equitable mechanism for federal sharing of provincial and territorial costs for natural disaster response and recovery where such costs would place an undue burden on a provincial or territorial economy.
There are currently 88 active natural disasters for which Orders in Council (OiC) have been approved, authorizing the provision of federal financial assistance under the DFAA, and for which final payments have not yet been made. Public Safety’s total outstanding share of liability under the DFAA with regards to these 88 events is estimated at $5.43 billion, the majority of which is expected to be paid out over the next five years.
DFAA liability has slightly decreased by $0.12 billion from $5.55 billion in the second quarter of fiscal year 2024-25 to $5.43 billion in the third quarter of fiscal year 2024-25. Variations in the DFAA liability are mainly attributable to:
- Changes for newly approved OiCs, which authorize funding related to recent natural disasters for which provinces and territories require federal sharing of costs;
- Changes in the estimates of the existing natural disasters; and
- Changes for payments issued under the existing obligation.
The following are the most significant events within Public Safety Canada’s DFAA liability:
- British Columbia 2021 November Storm ($1.5 billion);
- British Columbia 2021 Wildfires ($611 million);
- British Columbia 2020 Flood & Landslides ($411 million);
- Alberta 2013 June Flood ($410 million);
- British Columbia 2021 Flood & Landslides ($324 million); and
- Manitoba 2022 Spring Flood ($188 million).
Updates to the DFAA liability as a result of changes to the estimates of the existing natural disasters, are completed and approved twice a year with the last update having been conducted in Fall 2024 and is reflected in the current Quarterly Financial Report.
4.0 Significant Changes in Relation to Operations, Programs and Personnel
The Prime Minister appointed new ministers to the federal Cabinet, effective December 20, 2024:
- The Honourable David McGuinty has been named Minister of Public Safety; and
- The Honourable Rachel Bendayan has been named Minister of Official Languages and Associate Minister of Public Safety.
The Prime Minister appointed Tricia Geddes as Deputy Minister of Public Safety, effective October 31, 2024.
The Prime Minister announced the following additional appointments:
- Daniel Mills becomes the Associate Deputy Minister of Public Safety, effective December 2, 2024; and
- Jeffery Hutchinson becomes the Associate Deputy Minister of Public Safety (Emergency Management), effective December 9, 2024.
Public Safety also welcomed several colleagues from the Privy Council Office’s Emergency Preparedness Secretariat (PCO-EPS), by way of order-in-council effective November 21, 2024.
Joanne Garrah was appointed as the new Assistant Deputy Minister (ADM), Programs, effective January 21, 2025.
5.0 Approval by Senior Officials
Approved as required by the TBS Policy on Financial Management:
Tricia Geddes
Deputy Minister
Public Safety Canada
Ottawa (Canada)
Date: March 6, 2025
Patrick Amyot, CPA
Chief Financial Officer
Public Safety Canada
Ottawa (Canada)
Date: March 3, 2025
6.0 Statement of Authorities (unaudited)
| Total available for use for the year ending March 31, 2025Footnote 1 | Used during the quarter ended December 31, 2024 | Year to date used at quarter-end | |
|---|---|---|---|
| Vote 1 – Net Operating Expenditures | 303,630,785 | 65,624,805 | 175,631,849 |
| Vote 5 – Grants and contributions | 2,121,929,941 | 327,626,224 | 538,164,129 |
| Employee Benefit Plans (EBP) | 28,727,650 | 5,601,602 | 16,804,804 |
| Minister’s Salary and Motor Car Allowance | 98,600 | 16,466 | 65,866 |
| Total Authorities | 2,454,386,976 | 398,869,097 | 730,666,648 |
| Total available for use for the year ending March 31, 2024Footnote 2 | Used during the quarter ended December 31, 2023 | Year to date used at quarter-end | |
|---|---|---|---|
| Vote 1 – Net Operating Expenditures | 246,344,309 | 61,094,131 | 165,605,263 |
| Vote 5 – Grants and contributions | 2,502,775,847 | 195,641,668 | 378,625,619 |
| Employee Benefit Plans (EBP) | 22,384,523 | 5,111,028 | 15,384,514 |
| Minister’s Salary and Motor Car Allowance | 94,700 | 22,426 | 69,826 |
| Total Authorities | 2,771,599,379 | 261,869,253 | 559,685,222 |
7.0 Departmental budgetary expenditures by Standard Object (unaudited)
| Planned expenditures for the year ending March 31, 2025Footnote 3 | Expended during the quarter ended December 31, 2024 | Year to date used at quarter-end | |
|---|---|---|---|
| Expenditures: | |||
| PersonnelFootnote 4 | 215,207,610 | 52,108,408 | 153,539,744 |
| Transportation and communications | 2,086,317 | 1,727,261 | 3,292,193 |
| Information | 13,681,200 | 865,591 | 2,449,812 |
| Professional and special services | 58,778,383 | 12,920,259 | 28,195,998 |
| Rentals | 10,300,108 | 1,016,622 | 3,168,887 |
| Repair and maintenanceFootnote 5 | 13,459,161 | 1,894,562 | 2,004,448 |
| Utilities, material and supplies | 796,026 | 110,782 | 302,391 |
| Acquisition of land, buildings and works | 10,980,938 | - | - |
| Acquisition of machinery and equipment | 6,007,118 | 622,922 | 1,576,160 |
| Transfer payments | 2,121,929,941 | 327,626,224 | 538,164,129 |
| Public debt charges | - | - | - |
| Other subsidies and payments | 3,860,174 | 28,466 | 293,869 |
| Total gross budgetary expenditures | 2,457,086,976 | 398,921,097 | 732,987,631 |
| Less Revenue netted against expenditures: | |||
| Interdepartmental Provision of Internal Support Services | 2,700,000 | 52,000 | 2,320,983 |
| Total net budgetary expenditures | 2,454,386,976 | 398,869,097 | 730,666,648 |
| Planned expenditures for the year ending March 31, 2024Footnote 6 | Expended during the quarter ended December 31, 2023 | Year to date used at quarter-end | |
|---|---|---|---|
| Expenditures: | |||
| Personnel | 179,835,285 | 56,790,427 | 151,047,885 |
| Transportation and communications | 2,719,832 | 1,016,975 | 2,382,599 |
| Information | 11,195,414 | 1,112,987 | 2,332,510 |
| Professional and special services | 37,007,007 | 5,464,086 | 17,312,391 |
| Rentals | 9,964,825 | 1,331,268 | 3,167,857 |
| Repair and maintenanceFootnote 7 | 2,043,575 | 1,014,847 | 4,492,233 |
| Utilities, material and supplies | 823,535 | 78,129 | 224,749 |
| Acquisition of land, buildings and works | 18,921,668 | - | - |
| Acquisition of machinery and equipment | 5,541,698 | 252,186 | 1,324,473 |
| Transfer payments | 2,502,775,847 | 195,641,668 | 378,625,619 |
| Public debt charges | - | - | - |
| Other subsidies and payments | 3,470,693 | 7,484 | 1,563,958 |
| Total gross budgetary expenditures | 2,774,299,379 | 262,710,057 | 562,474,274 |
| Less Revenue netted against expenditures: | |||
| Interdepartmental Provision of Internal Support Services | 2,700,000 | 840,804 | 2,789,052 |
| Total net budgetary expenditures | 2,771,599,379 | 261,869,253 | 559,685,222 |
- Date modified: