2023 Annual National Data Report to Inform Trends and Patterns in Drug-Impaired Driving
Table of contents
- Table and Figures
- Executive Summary
- Introduction
- The Legislative and Programmatic Context
- How Cannabis Affects Driving Abilities
- Trends and Patterns in Drug-Impaired Driving
- What is Being Done to Address Drug-Impaired Driving
- Prevention and Detection
- Law Enforcement Capacity Building
- Standardized Field Sobriety Test (SFST) Training
- Drug Recognition Expert (DRE) Training and Certification
- Approved Drug Screening Equipment (ADSE)
- Law Enforcement Interventions
- Standardized Field Sobriety Testing
- Drug Recognition Evaluation
- Approved Drug Screening Equipment
- Blood Analyses
- Results
- Analysis and Conclusions
- References
Tables and Figures
- Table 1 - Driven a vehicle within 2 hours of smoking or vaping cannabis among past 12-month users, by province/territory, Canada, 2019-2022
- Table 2 - Driven a vehicle within 4 hours of ingesting cannabis among past 12-month users, by province/territory, Canada, 2020-2022
- Table 3 - Trends in annual, police-reported, impaired-driving incidents in Canada (total, alcohol and drugs), 2009 – 2022
- Table 4 – Trends in annual, police reported incidents involving drug-impaired driving in Canada, by age group, 2015 – 2022
- Table 5 – Prevalence of Injured Drivers by Substance and Province (2018-2022; updated February 2023; n=8,317 drivers)
- Table 6 – Prevalence of injured drivers by Number of Substance and Province (2018-2022; updated February 2023; n=8,317 drivers)
- Table 7 – Number of Fatally Injured Drivers with Toxicology Results, Saskatchewan, 2022
- Table 8 – Number of Fatally Injured Drivers with Toxicological Results, New Brunswick, 2022
- Table 9 – Number of SFST trained officers per year by province/territory, Canada, 2018-2022
- Table 9a – Total number of SFST trained officers by province/territory, Canada, 2019-2022
- Table 10 – Number of DRE trained and certified officers in 2018 to 2022
- Table 10a – Number of active DREs, 2020 – 2022
- Table 11 – Number of ADSE purchased, 2018-2022
- Table 12 – SFST Frequency of Use and Results 2021 & 2022
- Table 13 –Frequency of DRE Opinion Category by Province, RCMP national DEC data, 2018
- Table 14 – Frequency of DRE Opinion Category by Province, RCMP national DEC data, 2019
- Table 15 – Frequency of DRE Opinion Category by Province, RCMP national DEC data, 2020
- Table 16 – Frequency of DRE Opinion Category by Province, RCMP national DEC data, 2021
- Table 17 – Frequency of DRE Opinion Category by Province, RCMP national DEC data, 2022
- Table 18 – Number of DID Laboratory Blood Analysis Requests by Type and Province, 2019-2021
- Table 19 – Manitoba Blood Draw Toxicological Results, 2018-2022
- Table 20 – Cannabis Possession Charges in Canada, Pre-Legalization (2015-2017) and Post-Legalization (2019), By Age Group
- Table 21 – Administrative Sanctions, Ontario, 2018-2021
- Figure 1 – Blood THC (ng/ml) levels after smoking (minutes)
- Figure 2 – Trends in annual, police-reported, impaired-driving incidents in Canada (total, alcohol and drugs)
- Figure 3 – Number of fatalities of individuals who tested positive for Cannabis, Ontario, 2017-2020
- Figure 4 – Total Drug Recognition Expert (DRE) Operational Evaluations (annual)
- Figure 5 – Average Number of Evaluations per DRE (annual)
- Figure 6 – DRE Evaluations: Frequency of Opinion Categories, Canada, 2022
Executive Summary
In the context of cannabis legalization, the Government of Canada introduced legislation to create new offences and provide additional tools to law enforcement to detect and deter drug-impaired driving (DID). Furthermore, to support the implementation of this new legislative framework, the Government invested $161M over five years initially to enhance training of frontline law enforcement officers in how to recognize the signs and symptoms of drug-impaired driving, build law enforcement capacity across the country, provide access to approved drug screening equipment (ADSE), develop policy, bolster research, and raise public awareness about the dangers of drug-impaired driving. An important part of this initiative is to inform Canadians on activities undertaken to address DID and their results. It is the purpose of this annual report.
This is the fourth annual report on trends and patterns in DID. It is produced in cooperation with the provinces and territories, the RCMP, CBSA, and other partner agencies and stakeholders.
Whenever possible, it updates data from the 2022 report. However, as in 2020, the COVID-19 pandemic resulted in a significant reduction in planned activities, in particular the training of law enforcement officers. Nevertheless, the report's findings show that the federal initiative has continued to enhance law enforcement capacity to detect and deter DID. It has also continued to change Canadians' attitudes towards driving after cannabis use. Furthermore, data from police and border-reported incidents as well as toxicological analyses among injured and fatally injured drivers indicates that the number of incidents involving drivers with drugs in their system, including cannabis, has been constantly increasing since 2008 as a proportion of all impaired driving incidents.
Work to improve the completeness and comparability of data has continued in 2022. As a result, more data is now collected on the use and results of standardized field sobriety testing and approved drug screening equipment, as well as on injured drivers is now available, while data from coroners and medical examiners on fatally injured drivers is also gradually improving.
Introduction
In spite of significant declines over the past 30 years, impaired driving, whether by alcohol or drugs, continues to kill or injure more Canadians than any other crime (Moreau, 2021). It also remains the single most important factor contributing to serious road crashes (CCSA, 2019).
It is no surprise then that with the legalization of cannabis, Canadians expressed concerns over road safety. Public opinion surveys showed that well over 80% of Canadians believed that DID would likely increase as a result of cannabis legalizationFootnote 1.
Canadians continue to be concerned over road safety as a result of cannabis legalization. Public Safety Canada has commissioned public opinion research on Canadians' attitudes, perceptions and behavior relating to cannabis and driving since 2017. The 2022 reportFootnote 2 shows that over half (56%; an increase from 49% in 2020) of Canadians perceive that the rate of driving while under the influence of cannabis has increased since legalization, and most are concerned (41%) or moderately concerned (31%) about others on the road who are driving under the influence of cannabis. However, alcohol remains a greater concern, with 95% agreeing that drinking alcohol impairs driving. Nearly nine in ten (86%; consistent with 2020 and an increase from 81% in 2017) agree that using cannabis also impairs one's driving ability. Four in five (80%) say that cannabis impacts reaction time and ability to concentrate and nearly two in three (67%) say that cannabis makes the user a worse driver. Nearly one in four (24%) continue to say that driving under the influence of cannabis is less dangerous than driving under the influence of alcohol.
In a survey conducted in March-April 2022 with a sample of 1567 Albertans, including 637 who had used cannabis in the past 12 months, 52% of respondents said they were concerned about drug-impaired driving, with older persons (55+) being significantly more concerned (68%) than younger ones (18-34; 36%).Footnote 3 Furthermore, only 28% of past 12-month cannabis users indicated being concerned about drug-impaired driving. Some 83% consider that cannabis impairs driving abilities (90% among non-users, 75% among users).
In September 2017, in response to Canadians' concerns over impaired driving, the federal government announced $161 million in funding for training frontline officers in how to recognize the signs and symptoms of drug-impaired driving, building law enforcement capacity across the country, providing access to approved drug screening equipment (ADSE), developing policy, bolstering research, and raising public awareness about the dangers of drug-impaired driving.
Furthermore, as a result of concerns over road safety at the time of cannabis legalization, Criminal Code provisions were enacted in 2018 to criminalize driving with prohibited levels of certain drugs, strengthen penalties and provide additional tools and means to law enforcement to detect and deter impaired driving, including DID.
Part of this initiative included a commitment to report to Canadians on trends in DID, activities undertaken to address the issue, and their results; it is the purpose of this report.
The report focuses on three broad questions:
- What can we say about trends and patterns in DID?
- What is being done to address DID?
- What are the results of these actions?
This report is the result of a collective effort undertaken in 2018 by the Federal/Provincial and Territorial (FPT) working group (WG) on DID. Comprised of representatives from all jurisdictions, as well as key stakeholders from the Department of Justice Canada (JUS), the Royal Canadian Mounted Police (RCMP), the Canada Border Services Agency (CBSA) and Transport Canada, the WG set out to work on identifying a series of indicators to help address these questions. The WG also engaged with Statistics Canada (STC) and with key expert organizations such as the Canadian Centre on Substance Use and Addictions (CCSA) as well as selected academics, to assess the relevance, reliability, availability and accessibility of data for these various indicators. In conducting this analysis, the WG benefitted from a comprehensive exercise undertaken by the CCSA to identify a set of national indicators on DID. The WG agreed on a preliminary set of indicators in spring 2019, which was further refined in September 2019. Subsequently, jurisdictions were asked to collect, collate, and report data on as many of these indicators as possible. The first annual trends and patterns report was published in 2020 and covered the 2019 calendar year.
This report presents data provided by provinces and territories, the RCMP and the CBSA for calendar year 2022. Data from reports and research studies from other sources (e.g., STC; CCSA) is also used.
The first section presents the key aspects of the legislative regime on DID adopted in 2018 and the accompanying federal initiative. The following sections present available data on trends and patterns in DID, action undertaken to prevent, detect and deter. DID, and results achieved. The conclusion summarizes the key findings and discusses next steps.
The Legislative and Programmatic Context
Driving while impaired by a drug has been a criminal offence since 1925, but this offence has always been challenging to prove in court.
Detecting and proving impairment caused by drugs is different and more complex than detecting and proving impairment caused by alcohol. Alcohol is a simple molecule with predictable impairing effects. As alcohol is consumed, blood alcohol concentration (BAC) rises; the higher the BAC, the more profound the impairment and the greater the risk of a serious road crash. The same correlation does not always exist for other drugs since their impairing effects and impacts on driving behaviour may vary depending on the substance, method of ingestion, and characteristics of the person and their consumption habits. In the case of cannabis, it is generally agreed that it can impair a person's ability to drive. However, there is no scientific consensus on the relationship between the concentration of Tetrahydrocannabinol (THC), its main psychoactive substance, in blood and the degree of impairment.Footnote 4
In 2008, new tools were authorized to facilitate the investigation of drug-impaired driving. These include the Standardized Field Sobriety Tests (SFST) used at the roadside (a three-pronged test consisting of walk and turn, one leg stand, and horizontal gaze nystagmus) and the Drug Recognition Evaluation conducted at the police station by a certified drug recognition expert (DRE). The Drug Recognition Evaluation is a 12–step evaluation that is designed to determine if the individual is impaired by a drug. To use either of these tools, the officer has to be specially trained in accordance with standards developed by the International Association of Chiefs of Police (IACP).
In the context of cannabis legalization, it was determined that more needed to be done to strengthen the criminal law regime with respect to drug-impaired driving. This was done as part of An Act to amend the Criminal Code (offences relating to conveyances) and to make consequential amendments to other Acts, which came into force in June 2018 and enacted new offences, and authorized new tools to enhance the detection and prosecution of drug-impaired drivers.
Specifically, the new measures:
- Authorize the police to use “approved drug screening equipment” (e.g., oral fluid drug screeners) at the roadside;
- Enact three new offences of having a prohibited blood drug concentration (BDC) within two hours of driving;
- Facilitate the ability of a police officer to demand a blood sample from a driver; and
- Permit a DRE to testify without requiring them to be qualified as an expert in every case, consistent with the 2017 Supreme Court of Canada decision in R v Bingley.
With the addition of the new offences, the text of the Criminal Code impaired driving offences currently reads as follows:
320.14 (1) Everyone commits an offence who
(a) operates a conveyance while the person's ability to operate it is impaired to any degree by alcohol or a drug or by a combination of alcohol and a drug;
(b) subject to subsection (5), has, within two hours after ceasing to operate a conveyance, a blood alcohol concentration that is equal to or exceeds 80 mg of alcohol in 100 mL of blood;
(c) subject to subsection (6), has, within two hours after ceasing to operate a conveyance, a blood drug concentration that is equal to or exceeds the blood drug concentration for the drug that is prescribed by regulation; or
(d) subject to subsection (7), has, within two hours after ceasing to operate a conveyance, a blood alcohol concentration and a blood drug concentration that is equal to or exceeds the blood alcohol concentration and the blood drug concentration for the drug that are prescribed by regulation for instances where alcohol and that drug are combined.
320.14 (4) Subject to subsection (6), everyone commits an offence who has, within two hours after ceasing to operate a conveyance, a blood drug concentration that is equal to or exceeds the blood drug concentration for the drug that is prescribed by regulation and that is less than the concentration prescribed for the purposes of paragraph (1)(c).
The prohibited BDC levels are not found in the Criminal Code, but instead, are set by regulation.Footnote 5 For paragraph 320.14(c), the prohibited BDC levels are 5 ng or more of THC per ml of blood, 5 mg of Gamma Hydroxybutyrate (GHB) per L of blood, and any detectable level of lysergic acid diethylamide (LSD), 6-Monoacetylmorphine (a metabolite of heroin), Ketamine, Phencyclidine (PCSP), Cocaine, Psilocybin, Psilocin and Methamphetamine in blood. For paragraph 320.14(d), the prohibited levels are a blood alcohol concentration of 50 mg of alcohol per 100 ml of blood in combination with 2.5 ng of THC per mL of blood. Finally, for subsection 320.14(4), the prohibited blood drug concentration (BDC) level is between 2 ng and 5 ng THC per ml of blood.
As noted, the Act authorized the use of approved drug screening equipment (ADSE) at the roadside.
ADSE can be used by police to detect the presence of some drugs in oral fluid, including THC. The police and Border Service Officers (BSO) can demand an oral fluid sample, if they have reasonable grounds to suspect a drug is in a driver's body. Reasonable suspicion that the driver has drugs in their body can be developed based on evidence of recent consumption of drugs and other objective facts, such as: red eyes, muscle tremors, agitation, or abnormal speech patterns.
A positive ADSE result confirms the presence of the drug and, combined with other signs of impairment or drug use observed by the police at the roadside, may provide grounds for the investigation to proceed further by making a demand for a blood sample or a drug recognition evaluation.Footnote 6 Similar screeners are used in other countries including the United Kingdom and Australia.
Currently, there are two approved devices available for use by law enforcement in Canada: the Dräger DrugTest® 5000 (which includes the Dräger DrugTest® 5000 STK-CA), and SoToxa™ (which is an Abbott SoToxa™ Test Cartridge and an Abbott SoToxa™ Oral Fluid Collection Device). Based on recommendations by the Drug and Driving Committee of the Canadian Society of Forensic Science, the Attorney General of Canada approved in 2018 these two devices for use by law enforcement. One is testing for cannabis only, the other for cannabis and cocaine.
The Federal Initiative
In September 2017, the Government of Canada announced that it was investing $161 million over five years to support the implementation of the new legislative regime on DID and build law enforcement capacity across Canada to recognize the signs and symptoms of DID, provide access to ADSE, develop policy, bolster research, and raise public awareness about the dangers of DID.
Of this funding envelope, $81 million was set aside specifically for Provinces and Territories (PTs) to ensure that they would be able to provide police officers with the training and tools they need. In particular, this funding was designed to increase training for Standard Field Sobriety Testing (SFST) and the Drug Recognition Expert (DRE) program; support the acquisition of ADSE; and collect standardized national data on DID trends and patterns. In addition, $12 million was allocated to the CBSA to provide BSOs with the training and tools to interdict impaired driving at land borders.
At the time when the federal initiative was launched, there were approximately 13,000 SFST trained law enforcement officers and close to 600 DREs across the country. Prior to this initiative, the CBSA did not train BSOs on detecting drug-impaired driving; officers were only trained in detecting alcohol-impaired driving. The CBSA committed to training 1,425 BSOs in the administration of the SFST. The objective is that 33% of front-line law enforcement officers and 30% of BSOs working at the land border will have been trained in SFST, and there will be 1250 active DREs by the end of the initiative, which is currently set to end in March 2025. Currently available statistics indicate that there are now over 29,000 SFST trained officersFootnote 7 and over 1,200 DREs. Public Safety Canada continues to work with PTs to help meet their training and capacity needs; close to $16 million in funding was available in FY 2021–2022.
A significant part of this initiative, in the context of cannabis legalization, is to monitor trends and patterns in DID. As such, Public Safety Canada (PS) is expected to:
- Produce annual reports on the scope and trends in DID, law enforcement capacity and action, impacts on public safety, successes and challenges, and impacts of cannabis legalization on road safety;
- Conduct research, including on the impairing effects of smoked and edible cannabis;
- Lead a horizontal evaluation of the initiative; and
- Contribute data on DID for the mandatory three-year review of the new impaired driving legislation led by Justice Canada.
As noted earlier, a FPT DID working group (DID WG) comprised of data analysts hired by PTs with the contribution program funding, PS representatives, and key stakeholders (e.g., RCMP, CBSA, Justice) has been created. In 2019, the WG developed a common framework and set of indicators which have since been used for the preparation of the annual data report. The WG continues to share information on current data collection practices, gaps and challenges, and next steps to improve data coverage and completeness. Recognizing the need to address outstanding data gaps on DID, PS enhanced the scope of the initiative in 2020 to allow provinces and territories to include data collection and research as reimbursable activities in the funding agreements.
Provincial and Territorial Initiatives
In response to cannabis legalization, all provinces and territories modified their existing legislation, including on drug-impaired driving. Most jurisdictions have adopted some form of zero tolerance policy for some categories of drivers including: young, novice, and commercial motor vehicle drivers. Sanctions are generally graduated and can include administrative license suspensions (e.g., immediate, 30, 45, or 60 days), fines or license reinstatement fees, ignition interlock requirements, and vehicle impoundment. The Canadian Centre on Substance Use and Addiction (CCSA) has prepared an overview of administrative sanctions in provinces and territories which can be consulted online.
How Cannabis Affects Driving Abilities
The issue of how and the extent to which cannabis impairs driving abilities has led to a large body of research studies, and there is overall consensus that cannabis affects driving performance.Footnote 8 However, it is not clear how these effects may be related to various factors, such as dosage. Furthermore, there remains knowledge gaps regarding the relationship between THC concentration in blood and degree of impairment. This is partly why Public Safety Canada supported a clinical trial conducted, by the Centre for Addiction and Mental Health (CAMH) to evaluate the impact of different doses of smoked cannabis on driving performance using a driving simulator. A total of 36 healthy adults who use cannabis 1-5 days per week were recruited and agreed to abstain from alcohol and other drugs not prescribed for medical purposes during the study.
Participants were given a single cannabis cigarette for all four drug conditions: the high dose contained approximately 165 mg THC, the medium dose contained approximately 94 mg THC, and the low dose contained approximately 47 mg THC, and the placebo dose 0 mg THC. The cannabis was obtained from a licensed producer, while the placebo cannabis was provided by the National Institute on Drug Abuse. Four drug administration sessions were conducted, with a minimum of 7 days between each session. Before administering the drugs, baseline measures such as urine, blood, saliva, and oral fluid samples were collected for testing, and vital signs were measured. Participants completed cognitive testing, subjective effect questionnaires, and driving simulations as practice. Cannabis (or the placebo) was administered and measurements were taken at multiple intervals, including cardiovascular measures, subjective effects, blood draws, and oral fluid samples. Driving was tested at baseline, 30 min and 1.5 h after cannabis exposure, while cognitive testing occurred 1 h after exposure. Participants were offered lunch and snacks in a lounge area. At the end of the session participants were sent home in a taxi.
Drivers were observed under full attention and divided (multi-tasking) conditions. While the average speeds were unaffected by either condition, effects on maximum speed, and standard deviation of lateral position (SDLP or weaving), and reaction time (RT) were observed as follows:
- Under full attention, the high and medium dose cannabis groups drove faster than the placebo group.
- Under divided attention, people drove faster at 90 minutes compared with at 30 minutes (regardless of cannabis dose).
- Under full attention, people were more likely to weave (regardless of cannabis dose). There was evidence that a higher dose led to increased weaving, but the difference was not statistically significant.
- Under divided attention, people were more likely to weave (regardless of cannabis dose). There was no evidence that a higher dose led to increased weaving compared to a lower dose.
- Under both divided and full attention, people were slower to react at both high and medium doses, regardless of time.
These results suggest that different doses of cannabis impact driving performance measures under both full and divided attention conditions in most cases, particularly on measures of maximum speed, SDLP, and RT. Importantly, while higher doses increase weaving and slow reaction time, there was no main effect on speed. Some analysis shows an impact on maximum speed, but the significance of this effect is unclear. The task of driving relies on multiple cognitive processes, and the impact of cannabis on driving is similarly complex and multi‐faceted. More research is needed to validate these findings and to explore other factors that may affect the relationship between cannabis and driving.
Participants' driving ability did not change much between 30 and 90 minutes after smoking. However, participants' perception of the effects of cannabis did change over time. They felt less high and less of a rush by 90 minutes after smoking. This is important because people may feel like the effects of cannabis are wearing off, but they may still be impaired and not safe to drive.
Blood cannabinoid data showed that the amount of THC in the blood was highest 5 minutes after smoking, and then decreased over time. Higher doses of cannabis led to higher levels of THC in the blood, and more tests are needed to ensure this is a real effect. There is a significant link between the amount of cannabis in participants' blood and their ability to drive. As THC levels increase, driving ability decreases. Finally, the preliminary findings show that THC levels in oral fluid are dependent on the dose of cannabis consumed. The highest THC levels were found at the 30 minute collection time point and significantly decreased by the 90 minute collection time point. However, THC was still detectable in oral fluid 360 minutes after consumption. The peak THC levels were higher with higher cannabis doses, indicating a dose‐dependent relationship.
Figure 1 – Blood THC (ng/ml) levels after smoking (minutes)
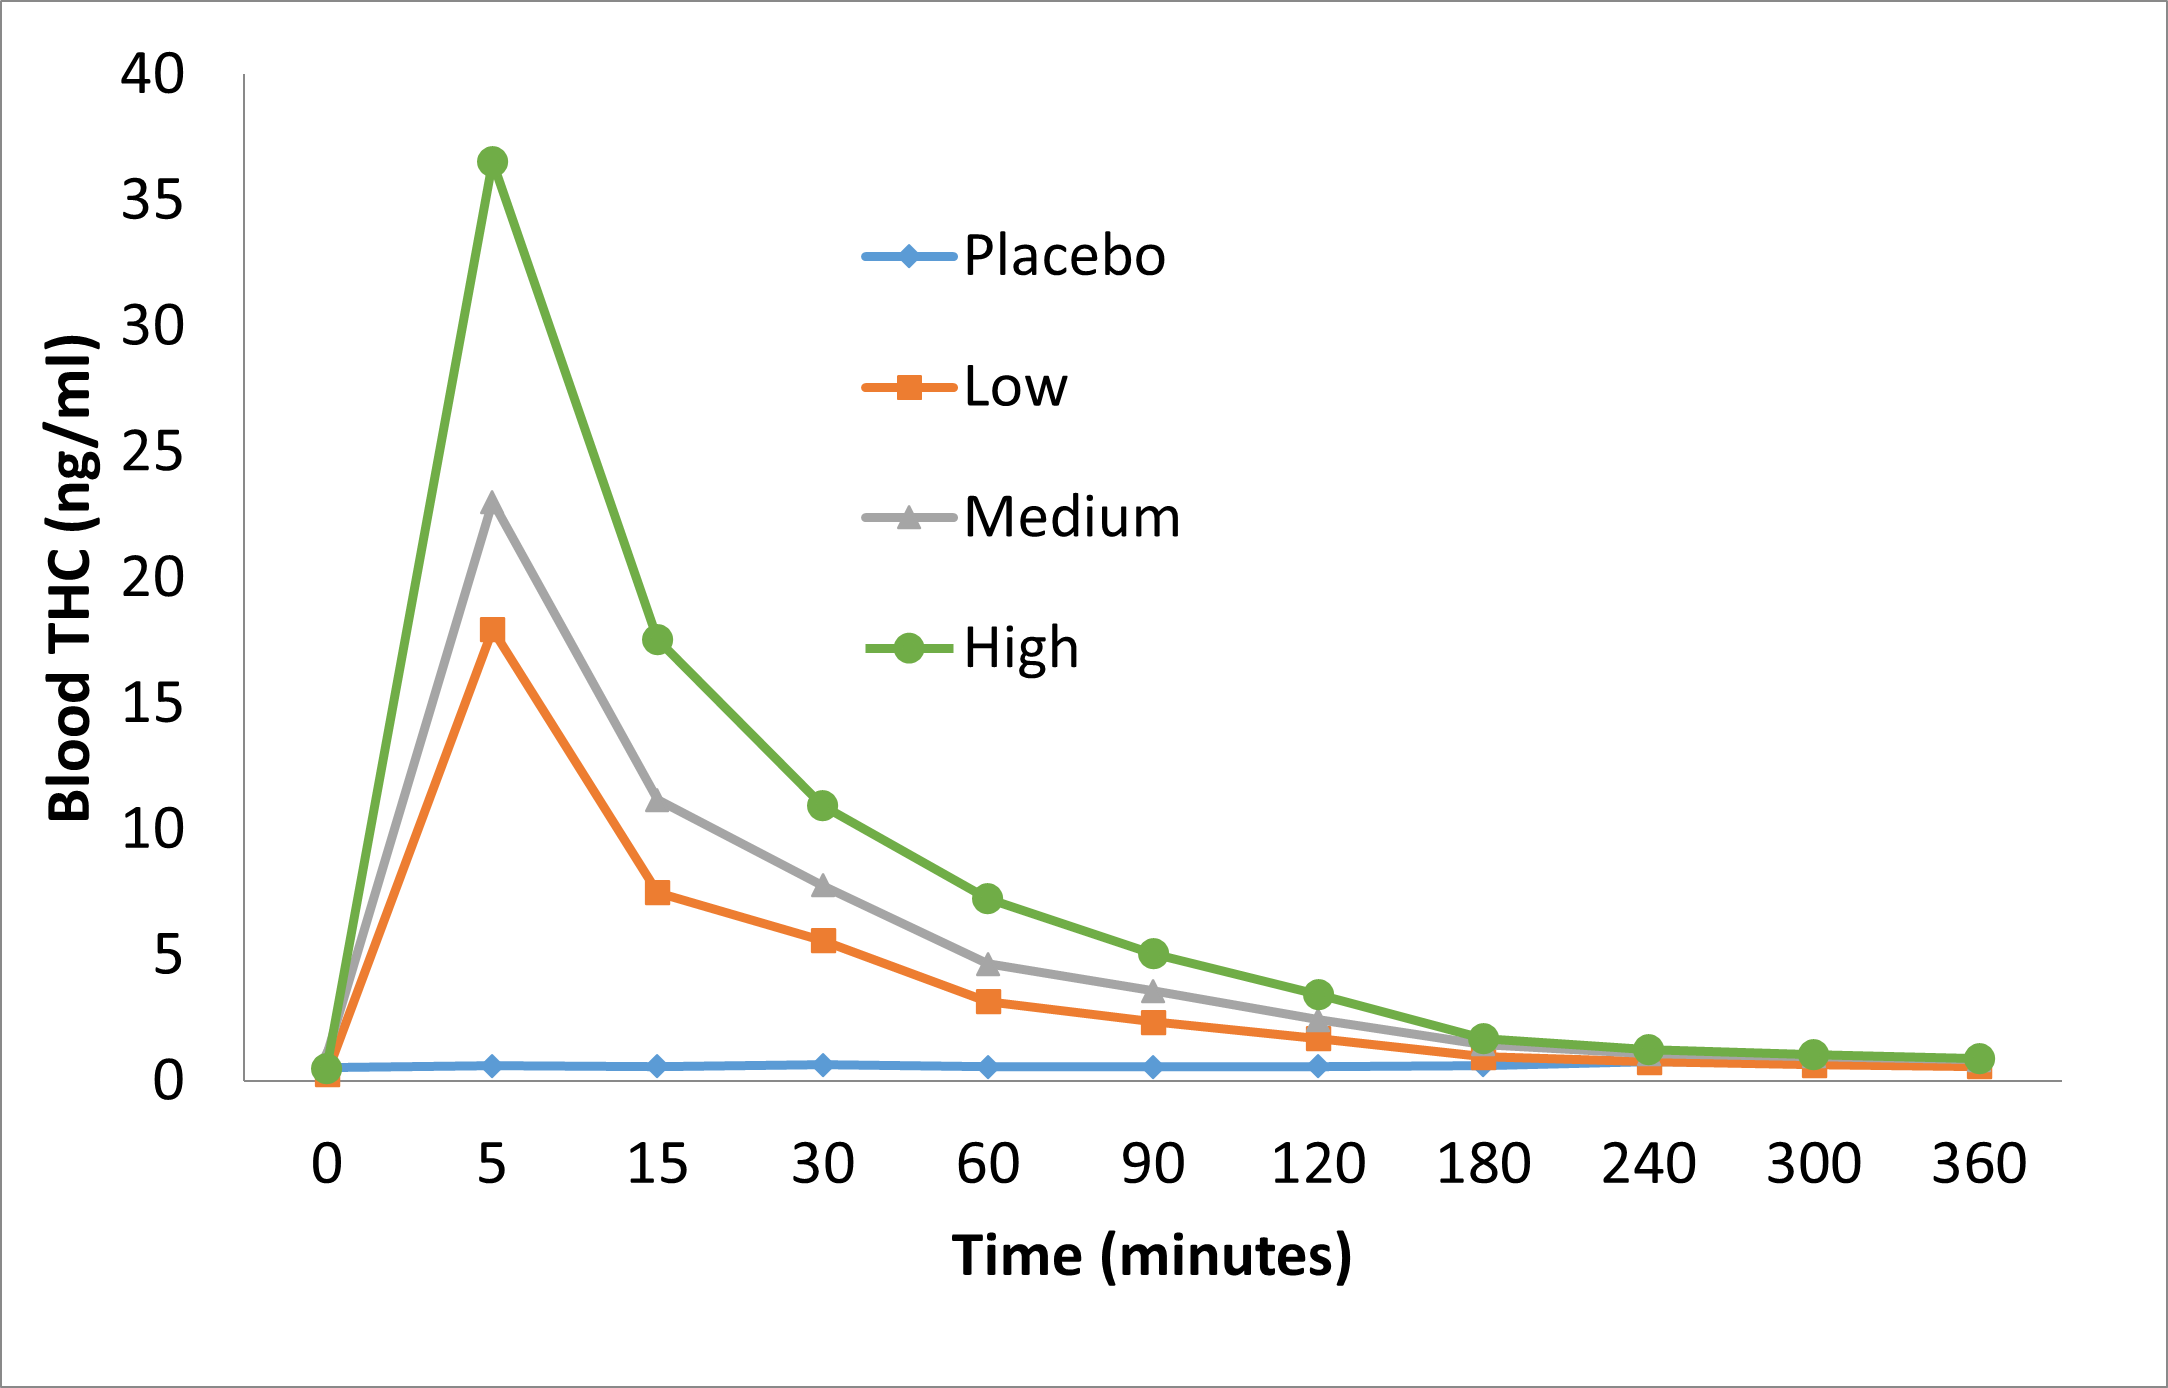
Image description
The graph illustrates that the amount of THC in the blood was highest 5 minutes after smoking, and then decreased over time. Higher doses of cannabis led to higher levels of THC in the blood. The peak THC levels were higher with higher cannabis doses, indicating a dose‐dependent relationship.
Overall, the effects were similar between 30 and 90 minutes after smoking and were potentially dose‐related. Subjective effects were also significant, but there were no significant dose‐dependent effects at 30 and 90 minutes. These findings add to the literature on the dangers of driving under the influence of cannabis. Future directions for this research include replicating the results with a larger sample size, utilizing a paced smoking procedure for standardized THC dosing, using more complex driving scenarios, studying various routes of cannabis administration, replicating the study with a wider population of cannabis users, and extending the results to a larger age range.
Trends and Patterns in Drug-Impaired Driving
There are various ways of measuring DID occurrences and incidents: population surveys asking a sample of Canadians to report on their driving behaviour after drug use; roadside surveys collecting oral fluid samples from a sample of voluntary drivers generally at night time and during summer months; police and border services officer (BSO) reported incidents; and toxicological analyses of injured drivers in hospitals and trauma centres, and of fatally injured drivers by coroners and medical examiners.
No single source is sufficient on its own and each has its limitations. Self-reported behaviour is hampered by accuracy and/or unwillingness to disclose behaviour. Roadside surveys' limitations include: the drug detection method (oral fluid) only indicates presence or absence of drugs; they are conducted in a small number of locations and at very specific and limited points in time; and they only involve drivers who agree to participate. Police and border service officer reported incidents only include incidents detected by or which come to the attention of law enforcement and may significantly under-estimate the true prevalence of impaired driving. Toxicological data on injured drivers is limited to only those drivers whose condition requires a visit to the hospital and the recency of blood sample collection. Coroners' toxicological data is limited by factors such as the level of toxicological analyses conducted (e.g., in some cases once alcohol is detected at an impairing level, they will not proceed with drug analysis), variable methodology between jurisdictions, and issues related to the unique characteristics of THC in blood in the case of cannabis.
The following sections present available data from each of these various sources.
Self-Reported Behaviour
Conducted by Health Canada, the Canadian Cannabis Survey (CCS) measures a variety of indicators related to cannabis, including self-reported driving behaviour following cannabis use among a sample of Canadians. The latest figures show that 23% of past 12- month users with a valid driver's license reported driving a vehicle within two hours of cannabis use, a reduction from 26% in 2019.Footnote 9 Results by jurisdiction are as follows:Footnote 10
Province and Territories |
% of people who drove within 2 hours of smoking cannabis |
How long ago did this happen? |
||||||||||
|---|---|---|---|---|---|---|---|---|---|---|---|---|
Within the past 30 days |
Within the past 12 months |
|||||||||||
2019 |
2020 |
2021 |
2022 |
2019 |
2020 |
2021 |
2022 |
2019 |
2020 |
2021 |
2022 |
|
BC |
32% |
27.5% |
24.1% |
24.7% |
41.3% |
39.4% |
36.5% |
43.9% |
33.8% |
35.8% |
- |
17.3% |
AB |
30.5% |
22.1% |
20.7% |
25.6% |
43.0% |
35.9% |
42.5% |
29.5% |
34.5% |
34.0% |
- |
30.7% |
SK |
34.6% |
32.9% |
34.1% |
30.3% |
- |
- |
- |
- |
- |
- |
- |
- |
MB |
- |
29.2% |
- |
24.3% |
- |
- |
- |
- |
- |
- |
- |
- |
ON |
22.3% |
20.8% |
19.9% |
20.4% |
38.7% |
38.1% |
28.8% |
36.3% |
28.8% |
28.0% |
29.8% |
29.6% |
QC |
26.5% |
17.0% |
13.3% |
26.1% |
54.9% |
39.5% |
- |
34.0% |
26.9% |
39.2% |
- |
31.5% |
NB |
24.8% |
22.4% |
29.1% |
23.2% |
- |
- |
- |
- |
- |
- |
- |
- |
NS |
25.1% |
17.4% |
24.2% |
25.0% |
- |
- |
- |
- |
- |
- |
- |
- |
PEI |
27.9% |
25.4% |
- |
24.6% |
- |
- |
- |
- |
- |
- |
- |
- |
NL |
27.3% |
25.3% |
- |
18.9% |
- |
- |
- |
- |
- |
- |
- |
- |
Territories |
- |
- |
- |
22.4% |
- |
- |
- |
- |
- |
- |
- |
- |
CANADA |
26.4% |
22.0% |
20.6% |
23.3% |
43.5% |
39.2% |
35.2% |
36.9% |
31.3% |
32.0% |
28.6% |
28.2% |
In 2021, Public Safety Canada commissioned Ekos Research Associates to conduct a public opinion research (POR) on DID. This POR, based on a sample of 2,193 respondents, found similar results to the 2017 and 2020 studies, with just over one-quarter (26%) of cannabis users reporting having operated a vehicle while under the influence in the past 12 months, which is somewhat higher than CCS results. Additionally, nearly one in three Canadians also reported that they have ridden in a vehicle operated by a driver who was under the effects of cannabis.
Starting in 2020, the CCS added a question on driving behaviour after using ingested cannabis products. This is an important addition since the effects of edible cannabis products on driving behaviour are not as well known yet likely different from those of smoked or vaped cannabis, given their different metabolism. The table below shows that the proportion of respondents who reported driving within four hours of ingesting cannabis increased slightly from 13.4% in 2020 to 14.0% in 2022.
Province and Territories |
% of people who drove within 4 hours of ingesting cannabis |
How long ago did this happen? |
|||||||
|---|---|---|---|---|---|---|---|---|---|
Within the past 30 days |
Within the past 12 months |
||||||||
2020 |
2021 |
2022 |
2020 |
2021 |
2022 |
2020 |
2021 |
2022 |
|
BC |
17.5% |
16.0% |
16.2% |
- |
- |
27.6% |
41.7% |
- |
39.1% |
AB |
13.2% |
14.0% |
17.2% |
- |
- |
42.7% |
- |
- |
23.7% |
SK |
- |
- |
18.2% |
- |
- |
- |
- |
- |
- |
MB |
- |
- |
17.7% |
- |
- |
- |
- |
- |
- |
ON |
13.0% |
12.1% |
12.7% |
30.7% |
- |
32.2% |
41.3% |
40.4% |
35.4% |
QC |
9.9% |
9.5% |
12.6% |
- |
- |
27.9% |
40.7% |
- |
47.4% |
NB |
- |
- |
12.0% |
- |
- |
- |
- |
- |
- |
NS |
- |
- |
8.8% |
- |
- |
- |
- |
- |
- |
PEI |
- |
- |
15.6% |
- |
- |
- |
- |
- |
- |
NL |
- |
- |
11.8% |
- |
- |
- |
- |
- |
- |
Territories |
- |
17.1% |
- |
- |
- |
- |
- |
- |
|
CANADA |
13.4% |
12.5% |
14.0% |
31.6% |
29.4% |
31.9% |
39.7% |
39.0% |
37.0% |
In 2022, British Columbia, Quebec and New Brunswick conducted their own population-based surveys.
In August 2022, the BC Cannabis Secretariat released the findings of its 2021 BC Cannabis Use SurveyFootnote 11. The survey assesses the behaviours and perceptions concerning cannabis use in BC. Of the 24,974 respondents surveyed, 32% reported using cannabis at least once in the past year, which is an increase from 28% before legalization. The survey found the vast majority (81%) of respondents believe cannabis impairs the ability to drive and this is slightly higher than in 2018 (79%). Another notable finding is that 70% of cannabis users believe cannabis impairs the ability to drive compared to 87% of non-users, and only 53% of daily cannabis users believe cannabis impairs the ability to drive. The survey also found 22% of respondents reported driving a vehicle shortly after using cannabis some point in their lifetime; however, self-reported driving after cannabis use has been decreasing (27% in 2018 vs 14% in 2021).
The Quebec Cannabis Survey has been conducted annually since 2018 except in 2020. The 2002 survey was based on a sample of 22,463 respondents aged 15 and over.Footnote 12 The 2022 results show that 19% have used cannabis in the past 12 months, unchanged from 2021 but higher than in 2018 (15%). Of note, the proportion of those aged 15-17 who used cannabis in the past 12 months has decreased since 2018, but increased among the 15-24. Almost 42 % of past 12 months cannabis users consumed less than once a month, 19% occasionally, 24% regularly, and 14% daily. Close to 88% of past 12 months users had not driven a vehicle under the influence of cannabis, but 7% had done so less than once a month, 1.8% each month, 1.4% each weekand 1.6% almost every day. Women are significantly less likely to report driving after cannabis use than men (83% vs 84%). Finally, it is important to note that frequency of use is related to the frequency of driving under the influence: while 98% of those using less than once a month had never driven under the influence of cannabis, the proportions were 91% among occasional users, 77% among regular users and 70% among daily users.
Results of the 2021-2022 New Brunswick Student Wellness Survey were released in May 2022Footnote 13. The survey collected information directly from 42,000 students in grades 6 through 12. Some of the survey's key findings include: 15.9% of students reported having used cannabis in the past 12 months (19.1% in 2018-2019 and 20.8% in 2015-2016); age of onset was 14.8 (15 in 2018-2019 and 13.7 in 2015-2106); the proportion of daily users was 3.5% unchanged from 2015-2016; and finally 17.3% of respondents indicated that they were passengers in a vehicle driven by someone under the influence of alcohol or drugs in the past 12 months, compared to 16,9% in 2015-2016.
Roadside Surveys
Five jurisdictions conducted surveys prior to cannabis legalization, providing a baseline against which to measure post-legalization change: Manitoba (2016), Ontario (2017), British Columbia (2018), Yukon (2018), and Northwest Territories (2018). The Canadian Council of Motor Vehicle Administrators (CCMTA) has produced a synthesis of these surveys' findings.Footnote 14
Of the total 7,265 drivers randomly selected, 80.7% agreed to participate, 97.7% provided a breath sample to detect alcohol and 90.2% provided an oral fluid sample to detect the presence of drugs.
Key findings include:
- 10.2% of drivers tested positive for drugs (compared to 4.4% for alcoholFootnote 15);
- 7.6% of drivers were positive for cannabis (THC);
- 12.9% of drivers were positive for alcohol, drugs, or both;
- Drug use was most prevalent among drivers aged 20 to 24 (14.0%) and decreased with increasing age;
- Only 2.1% of drivers aged 16 to 19 tested positive for alcohol; however, 10.4% of this age group tested positive for cannabis;
- Alcohol use was most common on Friday and Saturday nights (4.6% and 6.2%, respectively); and
- Cannabis use did not differ across survey nights, varying between 6.9% and 9.0%.
Compared to previous surveys, there has been a significant reduction in the prevalence of alcohol use among drivers, but a significant increase in the prevalence of drug use, cannabis in particular. Similar to other types of prevalence data, roadside surveys show that male drivers are more likely than female drivers (12% versus 7.4% respectively) to test positive for drugs.
In July 2022, the Yukon Territory conducted two separate roadside surveys in Whitehorse: for nighttime passenger vehicles, and for commercial vehicles. The passenger vehicles were surveyed between 21:00 and 3:00 on Wednesday through Saturday nights while the commercial vehicles randomly sampled drivers between 8:00 and 20:00 on Sunday through Wednesday. Drivers were asked a series of questions and an oral fluid sample was requested that would subsequently be tested in a toxicology laboratory for the presence of alcohol and drugs. Key findings include:
- 21.7% of passenger vehicle operators tested positive for drugs, slightly higher than 20.8% in 2018;
- Cannabis was the most common drug found in passenger vehicle drivers (over 80% of all drugs detected);
- Cannabis use amongst passenger drivers increased from 16.1% in 2018 to 18.1% in 2022;
- Overall, 19.5% of commercial operators tested positive for at least 1 psychoactive substance;
- Cannabis (11.7%) followed by cocaine (7.8%) were the most commonly detected drugs amongst commercial operators.
The Ontario Roadside Drug and Alcohol Survey was conducted in September of 2022. Data were collected in eleven communities across the province as a follow-up to comparable surveys in 2014 and 2017. Drivers were randomly sampled between the hours of 21:00 and 03:00 Wednesday through Saturday nights and invited to participate in the voluntary study. Of the 2,146 vehicles selected, 86.3% of drivers agreed to participate, with 88.1% providing a breath sample to measure alcohol use, and 81.5% providing an oral fluid sample to be tested for the presence of drugs. Key findings include:
- 17.8% of drivers tested positive for one or more psychoactive substances other than alcohol.
- Cannabis was the most commonly detected substance – 10.3% of drivers tested positive for cannabis.
- Younger drivers were more likely than older drivers to test positive for cannabis.
- Methamphetamine was the second most commonly detected drug (4.8%), followed by cocaine (3.1%).
- 19.4% of drivers who tested positive for alcohol also tested positive for drugs.
Manitoba also conducted a roadside survey in September-October 2022. The study was conducted on Wednesday to Saturday nights in seven Manitoba communities (Winnipeg, Brandon, Portage la Prairie, Selkirk, Steinbach, Thompson, and Winkler) and included a questionnaire, a breathalyzer test, and a drug test. In total, 1,266 drivers completed the study. The key results are as follows:
- Overall, 39 drivers (3.1%) tested positive for alcohol, up from 1.1% in 2016 (unweighted). In 2022, five individuals tested .05 or higher, up from two in 2016. When weighting these data for differences in traffic volume and population, the overall proportion of drivers who tested with a positive BAC on the survey was 3.6%, up from 0.6% in 2016. In addition, the various police services that performed check-stops caught 27 drivers above the legal limit (up from 16 in 2016). Adding these counts would increase the proportion 4.7%, up from 2.4% in 2016.
- There are few statistical differences between groups. The only noticeable difference was that the proportion with a positive BAC increased with age from 1% of those 18 to 24 to 6% of those 55 and older. There was also some evidence to suggest that those coming from an event or bar/pub/nightclub were more likely to test positive.
- The drug test administered to drivers tested for amphetamines, benzodiazepines, cannabis, cocaine, methamphetamine, and opioids. The unweighted drug test results found that 9% of drivers tested positive for at least one drug, virtually unchanged from 2016 (10%). Weighted results decreased the proportion slightly to 8% (10% in 2016). Unweighted drivers testing positive for drugs had an average of 1.3 types of drugs detected in their system (1.4 in 2016). The majority of positive drug tests were for cannabis (61%), followed by cocaine (21%) and opioids (8%), which was similar to 2016 with slight changes.
- Examining drug use (weighted), shows higher rates of drug use for Thompson (18%), Selkirk (16%), and pickup (17%) drivers, and lower rates for van (2%) and Winkler (1%) drivers. Otherwise, there were very small differences by other demographic (e.g., sex, age) or other factors (e.g., day of the week, time of day).
- Although the majority of drivers (88%, up from 78% in 2016) were aware that a person can face licence suspension when tested with a BAC over .05, they were uncertain about the number of drinks required for them to reach this limit, with 69% indicating they did not know. On average, drivers believed it takes them about 1.9 drinks to reach a BAC of .05.
- Although the vast majority of drivers indicated that they find it very easy to avoid drinking and driving (88%, up from 84% in 2016), drivers offered opinions on why some people may find it difficult. The most common reason given was that people do not think they are impaired (52%) and people don't think they will be caught (51%), which were also the two most common answers in 2016.
Law Enforcement-Reported Incidents
Law enforcement officers typically come in contact with impaired drivers through a traffic stop. Officers can also encounter impaired drivers when attending traffic collisions, conducting roadside checks randomly at various times during the year (e.g., Christmas and New Year), or other means. CBSA officers may come into contact with impaired driving through border processing and demand a preliminary breath sample or conduct a standardized field sobriety test (SFST). Law enforcement may do a number of things depending on the circumstances: demand a preliminary breath sample, conduct a standardized field sobriety test (SFST), or collect a sample of oral fluid using ADSE. If the officer has reasonable grounds to believe that the operator of the vehicle has committed an offence, the person can be required to provide a blood sample or submit to a DRE, or imposed an administrative penalty (e.g. fine or license suspension) under the relevant provincial/territorial legislation.
Various data may be collected at each of these stages, but whether and how it is collected varies significantly both between jurisdictions and type of tool used. Data on police-reported incidents is collected systematically and reported annually through Statistics Canada's Uniform Crime Reporting (UCR) Survey. Similarly, data is systematically collected when a DRE is conducted or blood analysis are requested. However, data is not systematically collected when a preliminary breath test or SFST is conducted or when ADSE is used. Data on CBSA enforcement actions at the border is maintained in Agency systems.
In addition to being limited to incidents that come to their attention, police data on DID incidents may under-represent their occurrence for a variety of reasons. Whenever the presence of alcohol is established, officers will typically pursue the alcohol-related charge and will not further investigate for the presence of drugs.Footnote 16 Other factors may explain under-detection and under-reporting such as the number or availability of detection capacity, or the fact that information may be lost since it is mostly manually entered.
UCR data indicates that the proportion of DID incidents reported by police has significantly increased relative to alcohol-impaired driving incidents over time. This is likely due to a combination of factors including changes in the legislation that facilitated investigation and charging of DID incidents, a significant increase in law enforcement awareness raising and training on how to detect and investigate DID, while at the same time several jurisdictions have been strengthening their administrative sanctions regime (e.g., BC's immediate roadside prohibition policy) and using it more frequently than the Criminal Code route.
CBSA enforcement data shows a parallel between drug and alcohol impaired driving arrests. In 2022, the Agency made 118 DID arrests, compared to 191 alcohol impaired driving arrests; 83% of the DID arrests were based on the results of SFST. In 2021, the Agency made 103 DID arrests, compared to 119 arrests for alcohol impaired driving; 88% of the DID arrests were based on the results of the SFST.
Police data for 2022 indicated that in all of Canada, 70,588 impaired driving incidents were reported, a decrease of over 1,000 incidents from 2021 (Statistics Canada, 2022). The highest rates (i.e., number per 100,000 population) were reported in the Yukon, the Northwest Territories and Nunavut, and the lowest in Ontario and Quebec. While the overall volume of impaired driving incidents declined, 2022 is also the first year since 2009 where the proportion of DID incidents reported by police decreased as a proportion of all impaired driving incidents. In 2022, there were 5,905 DID police-reported incidents, a decrease from 7,498 in 2021 and 7,411 in 2020. Provincially, only four jurisdictions saw an increase in DID incidents in 2022: PEI (+38), Yukon (+6), NWT (+7), and Nunavut (+8). The Atlantic provinces and the Territories reported the highest rates of DID among provinces, Ontario, Manitoba, and Alberta the lowest.
Figure 2 – Trends in annual, police-reported, impaired-driving incidents in Canada (total, alcohol and drugs) Footnote 17
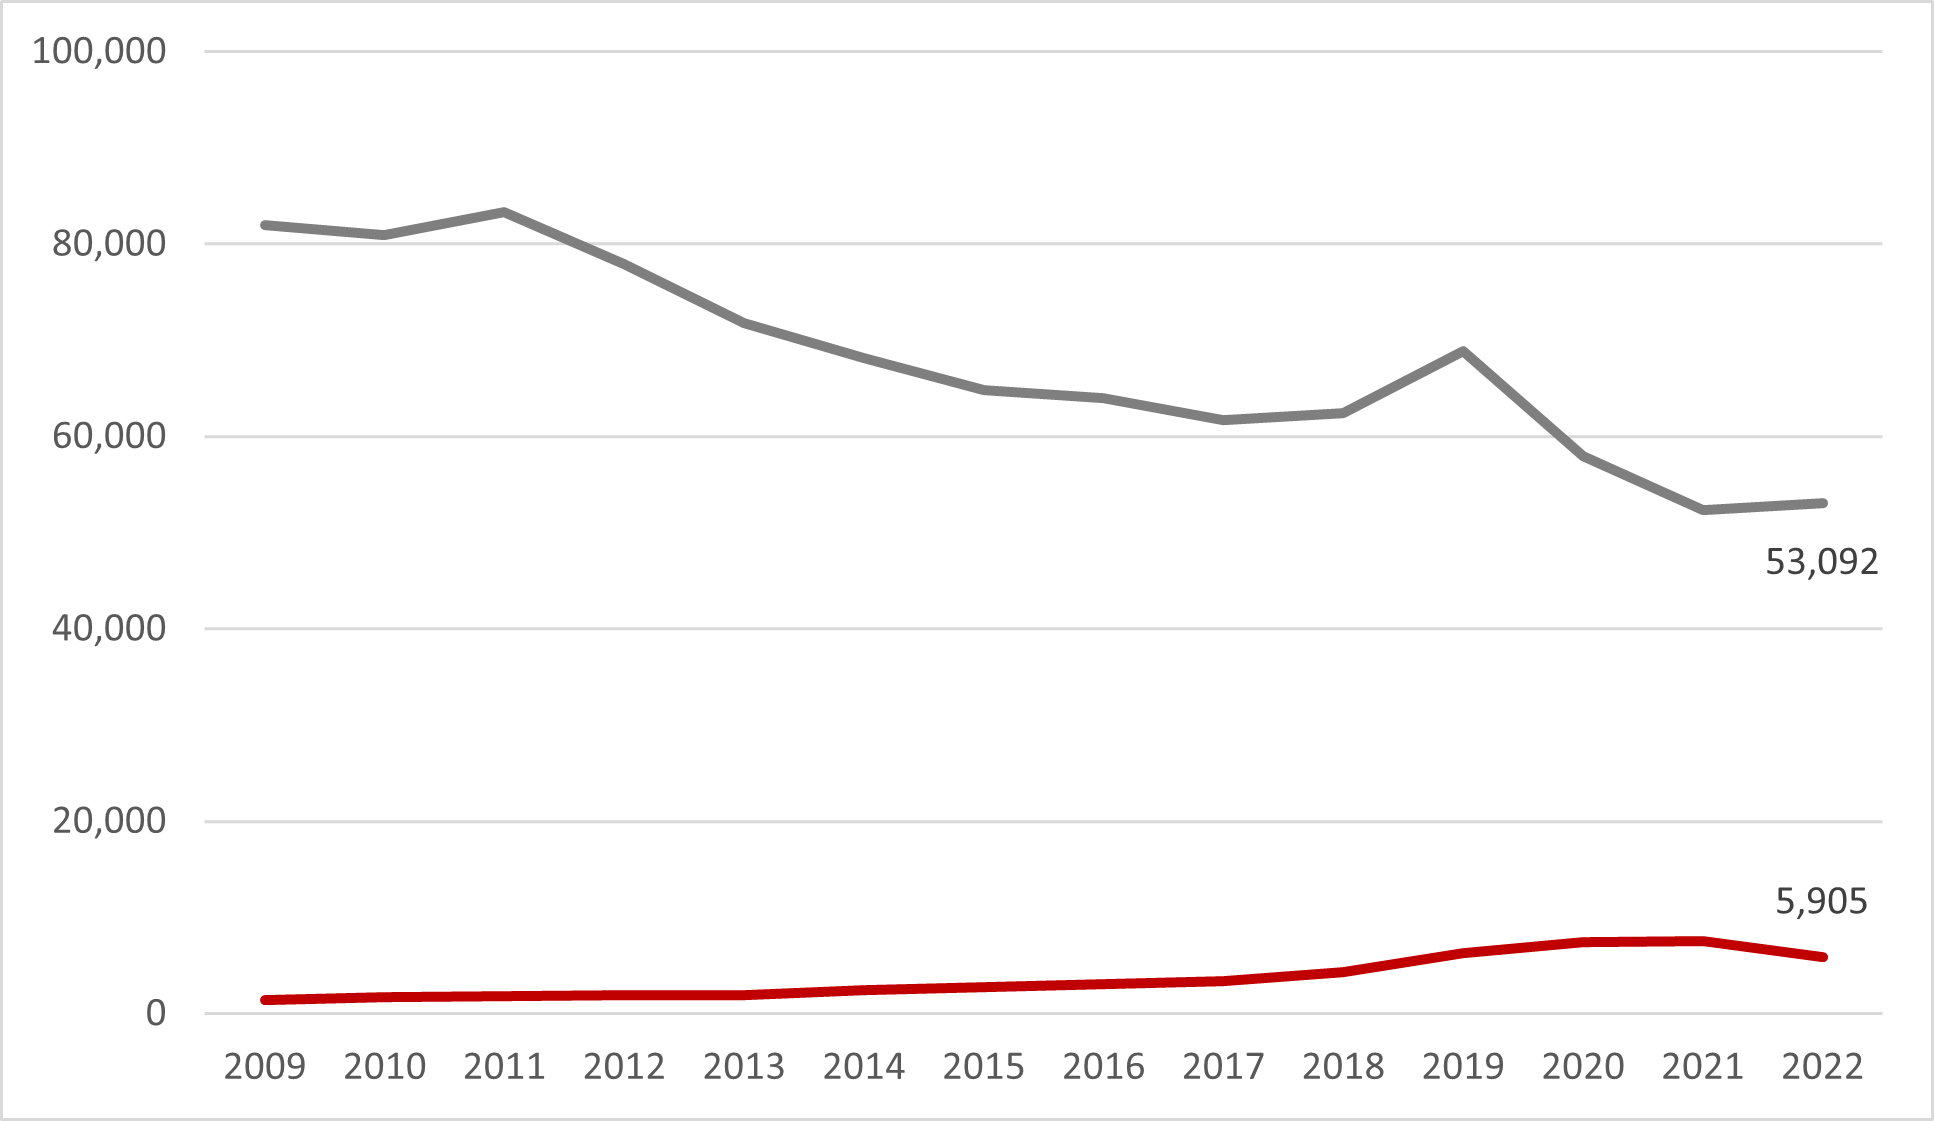
Image description
The graph illustrates that the total number of drug-impaired driving incidents reported by police has increased over time compared to alcohol-impaired driving incidents, which have decreased (with the exception of 2019). In 2022, reported 5,905 incidents of drug-impaired driving compared to 57,221 incidents of alcohol-impaired driving.
The graph illustrates that the total number of drug-impaired driving incidents reported by police has increased over time compared to alcohol-impaired driving incidents, which have decreased (with the exception of 2019).
Year |
Type of Offense |
||
|---|---|---|---|
Impaired Driving (Total) |
Operation while Impaired (Alcohol) |
Operation while Impaired (Drugs) |
|
2009 |
88,303 |
81,966 |
1,407 |
2010 |
87,231 |
80,958 |
1,679 |
2011 |
89,607 |
83,337 |
1,836 |
2012 |
84,149 |
77,947 |
1,912 |
2013 |
77,558 |
71,720 |
1,937 |
2014 |
74,577 |
68,178 |
2,460 |
2015 |
71,870 |
64,781 |
2,698 |
2016 |
71,304 |
63,968 |
3,073 |
2017 |
69,108 |
61,711 |
3,416 |
2018 |
70,832 |
62,366 |
4,356 |
2019 |
85,804 |
68,823 |
6,285 |
2020 |
77,838 |
57,996 |
7,411 |
2021 |
71,810 |
52,349 |
7,498 |
2022 |
70,588 |
53,092 |
5,905 |
Source: Statistics Canada
Alcohol-impaired driving incidents represented 81% of all impaired driving incidents in 2022; the rate of incidents per 100,000 population remained stable from 2021 to 2022 (136). DID represented 8.3% of all impaired driving incidents (an decrease from 9% the previous year), a rate of 16 per 100,000 population; those involving a combination of alcohol and drugs represented 6.5% of all incidents, a rate of 12 per 100,000. (Statistics Canada 2023).
Trends in DID incidents from 2015 to 2022 show that the total number of incidents has increased by over 45%. While the number of incidents involving young people (24 or younger) has decreased over the period, it has increased for the rest of the population, with the largest increase among those over 35 years old, nearly a 75% increase.
Age group |
Year |
Percent Change 2015-2022 |
||||||
|---|---|---|---|---|---|---|---|---|
Pre-legalization |
Post-legalization |
|||||||
2015 |
2016 |
2017 |
2019 |
2020 |
2021 |
2022 |
||
12 – 17 |
56 |
54 |
59 |
77 |
57 |
54 |
36 |
-35.71% |
18 – 24 |
578 |
698 |
711 |
673 |
885 |
720 |
479 |
-17.13% |
25 – 34 |
824 |
955 |
1,083 |
1,242 |
1,882 |
1,943 |
1,314 |
59.47% |
35 – 100 |
1,134 |
1,230 |
1,304 |
1,927 |
2,476 |
2,998 |
1,975 |
74.16% |
Total |
2,592 |
2,937 |
3,157 |
3,919 |
5,300 |
5,715 |
3,804 |
46.76% |
Source: Statistics Canada
The proportion of alcohol-impaired driving incidents cleared by charge has declined from 56.4% in 2019 to 54.3% in 2022; in the case of DID it has increased from 47.5% in 2019 to 56.3% in 2022.
As was noted by PerreaultFootnote 18:
The decrease in the proportion of incidents either cleared by charge or without charge is mainly because of an increase in the proportion of incidents not cleared, which rose from 22% in 2018 to 33% of all police-reported incidents of impaired driving in 2019. Of these uncleared incidents, the vast majority (97%) could not be cleared because of insufficient evidence. Incidents that were still under investigation when the data were submitted to Statistics Canada represented 2% of impaired driving incidents that were not cleared. Changes to the definitions of founded and unfounded criminal incidents may have led to an increase in the number of uncleared incidents, which could, in large part, account for the decrease in the relative proportion of cleared incidents.
Perreault had also observed that alcohol-impaired driving incidents take less time to be cleared by charge than DID incidents: while more than 76% of analyzed alcohol-impaired driving incidents were cleared by charge within a day or less, the proportion for DID cases was 59%. Furthermore, 37% of DID incidents took 31 days or more to clear by charge, compared to 17% of alcohol-impaired driving cases.
Toxicological Data from Injured Drivers
One of the most reliable methods to measure the prevalence and level of various substances in traffic incidents is to analyze blood samples among injured drivers presenting in hospitals and trauma centres. A team of researchers from the University of British Columbia under the direction of professor J.R. Brubacher is currently conducting an innovative study in Canada.
This prospective observational study currently obtains data from injured drivers treated in the emergency departments (EDs) in fifteen Canadian cities (Calgary, Edmonton, Halifax, Kelowna, Montreal, New Westminster, Ottawa, Quebec City, Regina, Saskatoon, Saint John, St John’s, Toronto, Vancouver, and Victoria). Three hospitals, one in Prince George BC, one in Sudbury ON and one additional site in Montreal QC will contribute to future reports (starting in 2024) resulting in a total of 18 trauma centers in 17 cities across Canada. The study is currently enrolling approximately 2500 injured drivers per year. This number will allow the investigators to report the prevalence of drug driving according to substance (cannabis, impairing medications, etc.) disaggregated by injury severity, region, sex, and age group. Continuous data collection will identify changes in in the prevalence of drug-impaired driving over time. Eligibility criteria include moderately or severely injured drivers of motorized vehicles (e.g. cars, motorcycles, trucks) who visit the ED of a participating hospital and have blood samples obtained within six hours of the crash. Blood samples are for clinical decision making and are not obtained for the purpose of toxicology testing. Cases where no excess blood remains after clinical use and cases that expire in the emergency department are excluded. Data from off-road vehicle drivers (collected since 2021) is reported separately. Injury severity is defined pragmatically as the need to obtain blood for clinical purposes (moderate injury) or need for overnight hospital admission (severe injury). The methodology overcomes many limitations of previous research. It measures drugs in blood, which for most drugs, correlates better with impairment than drug levels measured in saliva or urine. Rather than merely detecting presence or absence of drugs, the methods quantify alcohol, THC, COOH-THC and 83 other impairing drugs and medications. Additional “newly emerging” substances can be added to the toxicology panel in response to new information. This is a marked improvement over most roadside surveys because more substances can be detected and drug levels in blood are reported, which allow to comment on probable impairment. Additionally, blood is obtained shortly after the crash, in most cases within 1.5 h, so the toxicology results closely approximate drug levels at time of crash, simplifying interpretation of toxicology findings. The decision to obtain blood in this study is not based on suspicion of drug use. Blood obtained for the study is collected when clinically indicated for managing the patient’s injuries, based on crash mechanism and/or physical examination. Clinicians do not receive drug testing results from this study. This process eliminates the selection bias that would occur if drug testing were based on suspicion of drug use. Also, as this study has ethics approval for waiver of consent, it avoids the bias that would arise if drivers who used drugs were less likely to consent for testing, as might be the case in roadside surveys.
In a paper published in early 2022Footnote 19, Brubacher and team report on results from a sample of 4,339 injured drivers from British Columbia, — 3,550 before legalization (January 2013 to October 2018) and 789 after legalization (November 2018 to March 2020) — thus offering a unique opportunity to examine the potential impacts of cannabis legalization on the prevalence of cannabis use among injured drivers.
The study found that, after cannabis legalization, the prevalence of moderately injured drivers with a THC level of at least 2 ng per milliliter had more than doubled. The increase was largest among older drivers and male drivers. More specifically, before legalization, a THC level greater than 0 was detected in 9.2% of drivers, a THC level of at least 2 ng per milliliter in 3.8%, and a THC level of at least 5 ng per milliliter in 1.1%. The values after legalization were 17.9%, 8.6%, and 3.5%, respectively. After legalization, the adjusted prevalence ratio of drivers with a THC level greater than 0 was 1.33; 2.29 for those presenting a THC level of at least 2 ng per milliliter, and 2.05 for those with a THC level of at least 5 ng per milliliter. The largest increases in a THC level of at least 2 ng per milliliter were among drivers 50 years of age or older (adjusted prevalence ratio, 5.18) and among male drivers (adjusted prevalence ratio, 2.44). Notably, there were no significant changes in the prevalence of drivers testing positive for alcohol.
An annual report prepared by the UBC Road Safety and Public Health research team published in February 2023 shows results from blood samples from 8,317 injured drivers treated in 15 trauma centres across Canada from January 2018 to August 2022. Over half of the drivers (53.7%) tested positive for at least one impairing substance, and the most common single substance detected was cannabis with approximately one in six drivers (17.9%) testing positive for THC. While most of the THC positive drivers had relatively low levels which do not necessarily reflect recent use of cannabis, 7.8% of drivers had THC levels greater than 2 ng per milliliter, and 3.5% of drivers had levels greater than 5 ng per milliliter indicating recent use and often associated with impairment. Another striking feature of this study was the prevalence of polysubstance use, with approximately one in five drivers (21.8%) testing positive for more than one impairing substance positive for more than one impairing substance.
The data is also available for each jurisdiction participating in the study. The following table presents findings on the total number of injured drivers by type of substance. Note that the data are not broken down by year at this time.
National |
British Columbia (BC) |
Alberta (AB) |
Saskatchewan (SK) |
Ontario (ON) |
Quebec (QC) |
Atlantic Provinces (AP) |
||||||||
|---|---|---|---|---|---|---|---|---|---|---|---|---|---|---|
# |
% |
# |
% |
# |
% |
# |
% |
# |
% |
# |
% |
# |
% |
|
Total injured drivers |
8317 |
100.0 |
2775 |
100.0 |
1895 |
100.0 |
575 |
100.0 |
1613 |
100.0 |
914 |
100.0 |
545 |
100.0 |
Alcohol |
||||||||||||||
BAC > 0 |
1339 |
16.1 |
325 |
11.7 |
297 |
15.7 |
119 |
20.7 |
293 |
18.2 |
176 |
19.3 |
129 |
23.7 |
0 < BAC < 0.05% |
217 |
2.6 |
61 |
2.2 |
30 |
1.6 |
18 |
3.1 |
34 |
2.1 |
42 |
4.6 |
32 |
5.9 |
0.05% ≤ BAC < 0.08% |
95 |
1.1 |
25 |
0.9 |
19 |
1.0 |
8 |
1.4 |
28 |
1.7 |
13 |
1.4 |
2 |
0.4 |
BAC ≥ 0.08% |
1027 |
12.3 |
239 |
8.6 |
248 |
13.1 |
93 |
16.2 |
231 |
13.2 |
121 |
13.2 |
95 |
17.4 |
Cannabinoids |
||||||||||||||
COOH-THC > 0 |
2540 |
30.5 |
741 |
26.7 |
550 |
29.0 |
195 |
33.9 |
561 |
34.8 |
240 |
26.3 |
253 |
46.4 |
THC > 0 |
1491 |
17.9 |
453 |
16.3 |
279 |
14.7 |
123 |
21.4 |
289 |
17.9 |
201 |
22.0 |
146 |
26.8 |
THC ≥ 2 ng/mL |
647 |
7.8 |
175 |
6.3 |
118 |
6.2 |
64 |
11.1 |
124 |
7.7 |
79 |
8.6 |
87 |
16.0 |
THC ≥ 5 ng/mL |
288 |
3.5 |
66 |
2.4 |
59 |
3.1 |
34 |
5.9 |
50 |
3.1 |
38 |
4.2 |
41 |
7.5 |
Other substances |
||||||||||||||
CNS stimulants Footnote 20 |
978 |
11.8 |
280 |
10.1 |
239 |
12.6 |
66 |
11.5 |
171 |
10.6 |
118 |
12.9 |
104 |
19.1 |
CNS depressants Footnote 21 |
2 203 |
26.5 |
608 |
21.9 |
542 |
28.6 |
177 |
30.8 |
394 |
24.4 |
253 |
27.7 |
229 |
42.0 |
Opioids |
914 |
11.0 |
222 |
8.0 |
259 |
13.7 |
77 |
13.4 |
204 |
12.6 |
75 |
8.2 |
77 |
14.1 |
Any substance |
4463 |
53.7 |
1262 |
45.5 |
1075 |
56.7 |
352 |
61.2 |
868 |
53.8 |
523 |
57.2 |
383 |
70.3 |
The following table presents data by number of substances found among injured drivers.
National |
British Columbia (BC) |
Alberta (AB) |
Saskatchewan (SK) |
Ontario (ON) |
Quebec (QC) |
Atlantic Provinces (AP) |
||||||||
|---|---|---|---|---|---|---|---|---|---|---|---|---|---|---|
# |
% |
# |
% |
# |
% |
# |
% |
# |
% |
# |
% |
# |
% |
|
Total injured drivers |
8317 |
100.0 |
2775 |
100.0 |
1895 |
100.0 |
575 |
100.0 |
1613 |
100.0 |
914 |
100.0 |
545 |
100.0 |
Number of substancesFootnote 22 |
||||||||||||||
1 |
2651 |
31.9 |
783 |
28.2 |
660 |
34.8 |
200 |
34.8 |
515 |
31.9 |
308 |
33.7 |
185 |
33.9 |
2 |
1266 |
15.2 |
349 |
12.6 |
304 |
16.0 |
104 |
18.1 |
241 |
14.9 |
154 |
16.8 |
114 |
20.9 |
3 or more |
546 |
6.6 |
130 |
4.7 |
111 |
5.9 |
48 |
8.3 |
112 |
6.9 |
61 |
6.7 |
84 |
15.4 |
Alcohol and THC |
||||||||||||||
BAC > 0 & THC > 0 |
407 |
4.9 |
94 |
3.4 |
86 |
4.5 |
44 |
7.7 |
80 |
5.0 |
59 |
6.5 |
44 |
8.1 |
BAC ≥ 0.05% & THC ≥ 2 ng/mL |
135 |
1.6 |
32 |
1.2 |
24 |
1.3 |
19 |
3.3 |
29 |
1.8 |
18 |
2.0 |
13 |
2.4 |
Alcohol and other substances |
||||||||||||||
BAC > 0 & CNS stimulants |
306 |
3.7 |
69 |
2.5 |
62 |
3.3 |
24 |
4.2 |
62 |
3.8 |
46 |
5.0 |
43 |
7.9 |
BAC > 0 & CNS depressants |
407 |
4.9 |
87 |
3.1 |
91 |
4.8 |
33 |
5.7 |
80 |
5.0 |
55 |
6.0 |
61 |
11.2 |
BAC > 0 & Opiates |
148 |
1.8 |
27 |
1.0 |
34 |
1.8 |
15 |
2.6 |
38 |
2.4 |
18 |
2.0 |
16 |
2.9 |
THC and other substances |
||||||||||||||
THC > 0 & CNS stimulants |
289 |
3.5 |
77 |
2.8 |
51 |
2.7 |
31 |
5.4 |
50 |
3.1 |
47 |
5.1 |
33 |
6.1 |
THC > 0 & CNS depressants |
424 |
5.1 |
111 |
4.0 |
73 |
3.9 |
41 |
7.1 |
78 |
4.8 |
58 |
6.3 |
63 |
11.6 |
THC > 0 & Opiates |
186 |
2.2 |
41 |
1.5 |
41 |
2.2 |
17 |
3.0 |
42 |
2.6 |
20 |
2.2 |
25 |
4.6 |
Coroners' Toxicological Data
Coroners and medical examiners report data from toxicological analyses of different specimens (e.g., blood, urine, hair, etc.) from fatally injured drivers. However, similar to police investigations, many coroners will not conduct further analyses if alcohol is present and can clearly be established as a probable cause of death. Furthermore, if the cause of death is obvious, many will not conduct toxicological analyses; this decision is, in part, related to the time and costs of conducting such analyses. Furthermore, methods may vary between jurisdictions, making it difficult to compare data. For information relating to research from the Traffic Injuries Research Foundation in 2017, please refer to the previous Annual National Data Report to Inform Trends and Patterns in Drug-Impaired Driving.
In its 2022 report, Quebec provides a series of data from the Laboratoire de sciences judiciaires et de médecine légale (LSJML) and the Coroners Office. LSJML cases are analyses of urine or blood samples from impaired drivers. One should remember that while blood samples indicate recent use, such is not the case for urine samples since traces of THC can remain in urine for days, up to 30 days among regular users. 2021 LSJML data show that methamphetamines are most frequently detected, followed by cannabis and cocaine. (LSJML, 2023). Since data on requests for cannabis analyses are incomplete, 202 data are presented. Of the 588 requests, 13% had a THC blood concentration between 0.5 and 1.9 ng/mL, 17% between 2.0 and 4.9 ng/mL, and 16% over 5 ng/mL. A THC rate below 2 ng/ml does not necessarily indicate recent use, while a rate over 5 ng/ml is associated with impaired driving and recent use. In addition, a rate over 5 ng/ml increases the likelihood of a responsible crash. Poly drug use was found in 83% of cases.
Coroners data for 2019-2022 do not represent all deceased drivers since only about 72% are tested for the presence of drugs. Furthermore, 2019 data are 99% complete and 2020 data are 98% complete, but 2021 and 2022 data are only 88% and 48% complete due to delays in concluding analyses and reporting data. Substances most often detected since 2019 are cannabis, cocaine and methamphetamines, which is aligned with LSJML data. The only significant change observed during this period it that methamphetamine is significantly more present in 2022 than in 2019. Also, negative cases are proportionately less frequent since 2019, while the proportion of cases involving cannabis is increasing, although these results are not statistically significant. Among those testing positive for cannabis in 2022, (n=20), 40% (n=8) had also used another drug (Coroner's office 2023; unpublished data). The proportion ranged from 35% to 50% between 2019 and 2021.
Data from the Saskatchewan Coroners Service showed a total of 57 deceased drivers in 2022. It's important to note that cannabis only detected along with another substance, and never alone. The toxicology results are shown in the following table.
Male |
Female |
Unknown |
Total |
|
|---|---|---|---|---|
Deceased driver |
40 |
17 |
0 |
57 |
Toxicology completed on deceased driver |
37 |
16 |
0 |
53 |
No drugs/no alcohol detected |
8 |
7 |
0 |
15 |
Drugs/alcohol detected (poly drug use) |
23 |
7 |
0 |
30 |
Alcohol (only) detected |
1 |
1 |
0 |
2 |
Alcohol in blood ≥ 80 mg% |
10 |
7 |
0 |
17 |
Cannabis (only) detected |
0 |
0 |
0 |
0 |
Cannabis detected combined with other drugs including alcohol |
10 |
2 |
0 |
12 |
Other drugs detected |
19 |
7 |
0 |
26 |
The New Brunswick Coroners' Office maintains statistics regarding fatal motor vehicle traffic crashes in the jurisdiction. Although data was reported on 55 cases, the table below provides further detail on the 42 cases where a driver was involved and the coroner's investigation has been completed.
Male |
Female |
Unknown |
Total |
|
|---|---|---|---|---|
Deceased driver |
37 |
5 |
0 |
42 |
Toxicology completed on deceased driver |
28 |
5 |
0 |
33 |
No drugs/no alcohol detected |
7 |
0 |
0 |
7 |
Drugs or alcohol detected |
22 |
4 |
0 |
26 |
Alcohol (only) detected |
2 |
0 |
0 |
2 |
Cannabis (only) detected |
3 |
1 |
0 |
4 |
Cannabis detected combined with other drugs including alcohol |
12 |
0 |
0 |
12 |
Other drugs detected |
5 |
3 |
0 |
8 |
The Ontario coroners' data up to 2020 is available for analysis. Of 148 collision fatalities in 2020, 87 (59%) tested for cannabis alone or in conjunction with another substance. Results found for cannabis impaired drivers are shown in the following chart.
Figure 3 – Number of fatalities of individuals who tested positive for Cannabis, Ontario, 2017-2020
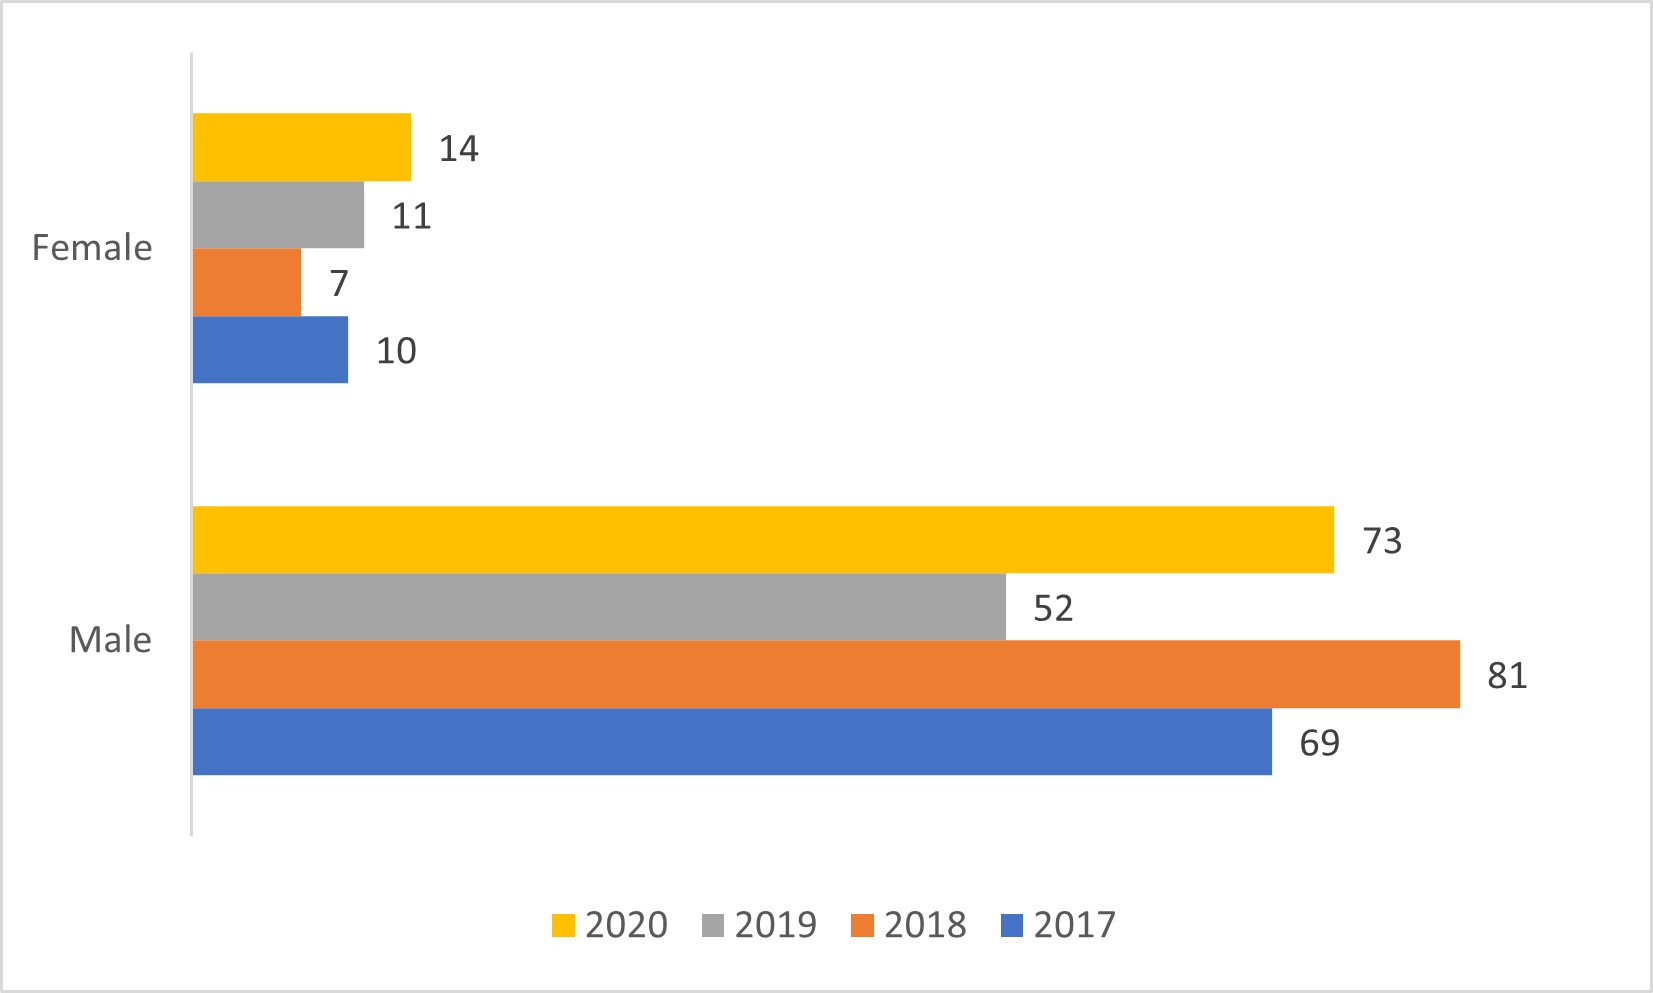
Image description
Year |
Female |
Male |
|---|---|---|
2020 |
14 |
73 |
2019 |
11 |
52 |
2018 |
7 |
81 |
2017 |
10 |
69 |
In Nunavut, three deceased drivers underwent a coroner's toxicological exam in 2022. Cannabis was detected in only one of the three instances.
What is Being Done to Address Drug-Impaired Driving
Similar to other crimes, DID can be addressed through a gradation of interventions including prevention, detection, and deterrence. Upstream, efforts are made to prevent its very occurrence, in particular through awareness raising and education which can be universal or targeted to specific at-risk groups of the population. Detection will be done through traditional policing methods including road checks and the use of screening tools such as ADSE and SFST. When impaired driving behaviour is detected, additional investigation may be conducted by making a DRE and/or blood sample demand. If the officer has reasonable grounds to believe that the driver is impaired, criminal charges can be laid and/or administrative sanctions imposed, to deter future similar behaviour, either of a specific individual or of the larger community (general deterrence). This section presents activities undertaken by the jurisdictions under these various approaches.
Prevention and Detection
Most jurisdictions have conducted various forms of preventative and detection interventions both before and after cannabis legalization. These interventions included public awareness campaigns on all types of media but mostly on social media channels, as well as targeted education campaigns in high schools, directed at drivers or at cannabis users in cannabis retail stores.
British Columbia
The BC Liquor Distribution Branch (BCLDB) implemented a “Don't Drive High” public educational campaign highlighting the risks and consequences of cannabis-impaired driving. Running through summer and again in October, the campaign involved a combination of social media, in-store, hardcopy and digital advertising, reaching approximately 800,000 impressions. Additionally, B.C. has conducted over the past 35 years a police-run roadblock tactic “CounterAttack”, which aims to catch drug and alcohol impaired drivers and reduce injuries and fatalities. B.C. ran two CounterAttack campaigns, one in July and one in December of 2022.
Alberta
Alberta sees many preventative interventions by different police services, targeting varying groups such as youth drivers, student drivers, city and neighbourhood street drivers, highway drivers, truck drivers, etc. These measures are enforced at different times and occasions including, but not limited to long weekends, holiday seasons, school zones constructions sites or sports and entertainment events. For example, the Edmonton Police Service (EPS) enforces what they call ‘Big Ticket' events, where at various times of the year numerous roadblocks are mounted and tickets issued to offending drivers. Speed limits throughout the school year are rigidly enforced and lastly, police sometimes maintain presence at both road construction sites and in areas where ‘speed fine doubles' signs are visible, to deter dangerous driving and promote safety.
As part of the National Impaired Driving Enforcement Day, Alberta's RCMP removed a total of 77 impaired drivers from the road, administering roadside sanctions from warning to immediate failure. During Operation Impact 2022, a 4-day safe driving initiative organized by the Canadian Association of Chiefs of Police, the Alberta RCMP issued over 2,650 tickets and removed 88 impaired drivers from the roads. Since 2006, the City of Edmonton has ran their “Curb the Danger” program where police and community collaborate to detect impaired drivers and report dangerous driving to 911 operators. There were 4,942 calls received in 2022 which resulted in 63 criminal impaired driving charges and 482 roadside sanctions. Finally, to promote public awareness of the risks of cannabis and drug-impaired driving, the City of St Albert rolled out the Cannabis in St. Albert website with key resources for Albertans.
Saskatchewan
In Saskatchewan, stakeholders, police services, Saskatchewan Government Insurance (SGI), Students Against Drinking and Driving (SADD) and Mothers Against Drinking and Driving (MADD) held various events and awareness to increase awareness the effects of the effects of impaired driving throughout 2022. SGI held the “Could You Live with Yourself” event in April by sponsoring TV, online, and radio advertisements that focused on reporting impaired driving statistics and tips. SGI also continued to offer “Ride for Free on NYE”, providing free bus transportation and paratransit services on New Years Eve in Saskatoon, Regina, Prince Albert, and Moose Jaw. Once again, MADD Canada continued to deliver programs aimed at Saskatchewan youth. The “SmartWheels” presentation for grades 4-6 was delivered 321 times at 95 schools, the “MADD School Program presentation for grades 7-12 was made 95 times at 83 schools, and the “Weed Out the Risk / Pot au volant” presentation for grades 7-12 was made 68 times at 36 schools (one of which was done in French). MADD's “Crashed Car Awareness Campaign” and “Billboard Campaign” displayed crashed cars and victims of impaired-driving in six municipalities as a visual reminder of the dangers of impaired driving. Over 560 individual signs or place-markers were used in the “Campaign 911 Mobile RID Program” where volunteers set up signs alongside the road in exact locations where impaired drivers were apprehended. Lastly, in partnership with SGI, municipal police services and the RCMP, MADD administered the “Positive Ticketing Campaign” rewarding sober drivers with gift cards. Over the Victoria Day weekend, 440 gift cards were distributed to sober drivers in 10 communities, and in December 833 were distributed in 13 communities. Of the 4,845 vehicles checked in December, 9 criminal code charges and 48 alcohol or drug impairment suspensions were reported by municipal police. As part of National Impaired Driving Enforcement Day, a total of 1,755 vehicles were inspected at 43 different checkstops. This effort resulted in 4 roadside suspensions for drug-impaired driving were issued.
Manitoba
Similar to 2021, Manitoba's Liquor, Gaming & Cannabis Authority promoted various public education campaigns on cannabis focusing on cannabis laws, low-risk usage, and products. However, during 2022, these campaigns have not focused specifically on drug impaired driving. Manitoba Public Insurance conducted multiple drug impaired driving media awareness campaigns (TV, Billboards and Paid Digital Ads) throughout the months of May, October and January of 2022.
Ontario
Ontario continues to raise awareness about the dangers of impaired driving by working with provincial and regional community groups across the province to launch and support a variety of road safety public education and awareness initiatives, including those that focus on impaired driving activities. During 2022, Ontario raised public awareness and knowledge of the effects of drugs and alcohol through several campaigns. These efforts ranged from webinars, to educational videos, to social media campaigns and educational programs. They included, for example: Vision Zero Youth Network's Teens Learn 2 Drive; Smart Serve Ontario's Smart Quiz; #KnowWhatImpairedMeans social media campaign; Thunder Bay Indigenous Injury Prevention Strategies (TIIPS); the Arrive Alive impaired driving countermeasures conference, Ontario Students Against Impaired Driving's Drug and Driving Webinar, and Students Against Impaired Driving (SAID) Day. In addition to these efforts, Ontario continues to do grassroots public outreach across the province at community events as well as targeted education campaigns in local schools, hospitals, libraries and key community groups such as newcomers, Francophones, Indigenous, older adults and youth.
Quebec
Quebec saw a growing concern around drunk driving in 2002, and every year since 2013, Québec's automobile insurance body (SAAQ) has carried out drug-driving campaigns and conducts an annual evaluation of its Cannabis and Alcohol Campaigns (CCA) campaigns. The CCA campaign measures perceptions and performance around drunk driving. In June and July 2022, the SAAQ supported a campaign aimed to “remind drivers that it's risky and dangerous to drive after consuming alcohol or drugs, even when the quantities consumed are small”.Footnote 23 The campaign consisted of bilingual audio messages broadcast on traditional and digital radio stations, a video broadcast on Facebook, and the posting of memes on Facebook as well. Evaluation of the campaign showed that although only 35% of French-speaking adults had taken note of the messaging, 91 % of respondents agreed that messaging was conveyed clearly, and 85% noted that the messages deterred them from impaired driving. Social media has also been utilized by some police to promote the prevention of CCA. Throughout 2022, Quebec's police force utilized Twitter and Facebook to promote the efforts of the police force, where a total of 122 publications regarding drug-impaired capacities were found. Once again in 2022, the most notable campaign was the National Concerted Operation Alcohol-Drugs which occurred from December 2, 2022 to January 2, 2023, campaigning for various themes related to road safety, including impaired driving. The Road Safety Coordination Committee is responsible for the (COPS) is responsible for the organization of the annual national operation. This committee raises awareness through activities and public campaigns from the SAAQ. This operation concentrated on action from Quebec territory was organized as part of a partnership between the Sûreté du Québec, the Service de police Sherbrooke, the Association of Quebec Police Directors and the SAAQ (Sûreté du Québec, 2023).
New Brunswick
New Brunswick is continuing its 2018 initiative with the Department of Health on a public education and awareness campaign regarding cannabis called ‘I'm in Control” whose objective is to raise awareness on DID and its risks associated with legalized cannabis and aims to minimize its harm. This campaign targets youth to know the facts and understand the risk associated with consuming cannabis, and for them to make informed decisions within their personal use. The second portion of this campaign was launched in 2019. These campaigns were delivered through various types of forums such as social media and traditional media i.e., blogs, smartphone apps, posters, etc. This ongoing campaign is comprised of several modes of delivery, with presence at festivals, awareness weeks, schools and campuses, and its evaluations are tailored to each specific tactic. The GNB also maintains the Cannabis in New Brunswick website, providing factual informative links to the GoC website by promoting ‘Don't Drive High” programs. Finally, in partnership with TraumaNB and the NB Road and Trail Safety Working Group, a summer public awareness campaign was launched in 2022 to address impaired driving. Promotional material related to this campaign is available online at GreatSummers.ca. The province utilized webpages, video media, still photography, billboards, digital promotion screens, social media, and public transit to advertise these campaigns. The province noted the most successful performance for this campaign was through social media ads on Meta (Facebook and Instagram) and TikTok, with 200,423 and 183,189 impressions respectively. Additionally, these media allow for targeted distribution of awareness material resulting in the greatest impact on the public.
Nova Scotia
The Government of Nova Scotia continues to maintain the website Be in the know to educate members of the public on cannabis related issues. While there were no formal media campaigns in Nova Scotia, police agencies regularly released information on Drug Impaired Driving and charges laid in efforts to educate the public and deter individuals from driving impaired.
Prince Edward Island
In 2022, PEI continued an impaired driving public awareness campaign that included radio advertisements, signs on bus shelters, billboards, social media content and rink boards to demonstrate the adverse effects alcohol and drug impaired driving has on first responders in the community. Stemming from the 2018 legalization of Cannabis, PEI continues with their public awareness campaign on laws surrounding cannabis, health risks, responsible usage, how to talk to youth and dangers around driving impaired. This campaign is found on social media, radio channels, newspapers, digital advertisements, posters, and can be further explored on the PEI provincial website — Just the Facts. In addition, the PEI Cannabis Management Corporation continues to fund various year-round public education campaigns, supported the promotion of a local ride share service over the holiday months, and in 2022, also sponsored the delivery of MADD Canada's “Weed Out The Risk” Programming in four schools. From late 2021 into 2022, the Department of Justice and Public Safety funded an Impaired Driving Initiative with local law enforcement agencies where police provided patrols of areas that are not typically surveilled by law enforcement. This initiative was a success, garnering positive feedback from the general public. The province is also working with a local marketing firm on the development of an impaired driving awareness campaign, to be launched in 2023.
Newfoundland and Labrador
The RCMP's Strategic Communications & Media Relations Unit regularly issues news releases to media outlets and social media channels on drug impaired driving and arrests, to both educate the public and serve as a deterrent. Media interviews are also conducted when necessary.
Nunavut
The Nunavut Territory took an active approach to encouraging people who consume cannabis to get home safely. Through the Nunavut Liquor and Cannabis Commission (NULC), 10,800 taxi vouchers were delivered to storefront consumers, at licensed establishments, liquor inspections, and RCMP/municipal enforcement inspections. The campaign proved successful as 8,507 of the 10,800 vouchers issued in Iqaluit were redeemed.
Northwest Territories
In 2022, the Northwest Territories Department of Infrastructure has evaluated safe driving campaigns and has also held workshops to ensure that the next campaign will be sending appropriate key messages to our target audiences. As of now, the GNWT JUS has extended an offer to partner with the Dept. of Infrastructure as part of its commitment to the Drug Impaired Driving Program. The NWT conducted Operation GingerbreadFootnote 24, and enforcement blitz to ensure road safety, and reduce the number of impaired drivers over the holiday season. This blitz was conducted across the territory December 2022.
Yukon
Mothers Against Drunk Driving (MADD) in Whitehorse ran the annual media campaign Project Red Ribbon. Beginning on November 1st and ending the first Monday in January, MADD collaborates with the RCMP and other government officials to administer check-stops to highlight the dangers of impaired driving.
In addition, in most jurisdictions, local and regional law enforcement organizations also conduct targeted awareness and education campaigns at selected periods of the year such as Christmas and the New Year, and highly publicized roadside checks operations, such as the Reduced Impaired Driving Everywhere (R.I.D.E.) operations conducted by the OPP.
Public Safety Canada's campaign, Don't Drive High, continued to raise awareness about the dangers of drug-impaired driving with:
- Over 7,000 visits to the Don't Drive High campaign landing page;
- A pilot experiential marketing activation with over 7,000 impressions; and
- Two digital audio spots with a reach of over 1.8 million.
Law Enforcement Capacity Building
As previously mentioned, key tools available to law enforcement include using the approved drug screening equipment (ADSE) and the SFST to detect DID, and DRE and blood drawsFootnote 25 to support the prosecution of DID offences. The federal government's initiative to support the implementation of the new DID legislative regime by law enforcement provides the opportunity for enhanced training in SFST and DRE, increased capacity to procure ADSE, and increased funding for the RCMP laboratory to conduct toxicological analyses.
Standardized Field Sobriety Test (SFST) Training
Originally designed for the detection of alcohol-impaired driving, SFST is an observational test consisting of three key components: Walk and Turn, One Leg Stand, and Horizontal Gaze Nystagmus. While used to detect impaired driving, including DID, in the USA since 1981, SFST was formally authorized as a screening tool for law enforcement to detect impaired driving in Canada in 2008, and training offered on its use in all provinces and territories. Although research is still ongoing to determine SFST's scientific validity for drugs (Porath & Beirness, 2014), extensive Canadian case law has recognized its use.
SFST training takes different forms. In some jurisdictions, it is only delivered in police colleges (e.g., Quebec's École nationale de police), but in most cases it is delivered by a combination of colleges and local law enforcement organizations (e.g., BC, Ontario). In Quebec, training on SFST is mandatory and is part of the initial training program for police officers at the police school. Also, SFST training is available to police officers on duty (course lasting 24 hours).
As part of the federal initiative to support the implementation of the new DID legislative regime, the national target is that 33% (or approximately 21,000) of all frontline law enforcement officers will have been trained in SFST over five years.Footnote 26 The CBSA initiated SFST training in 2018 as part of the DID initiative.
As can be seen in Table 9 below, the number of officers trained in SFST has continued to increase in 2022 following the declines in 2020 due to the COVID pandemic.
Province and Territories |
# of SFST officers trained in |
Average cost per officer |
|||||||
|---|---|---|---|---|---|---|---|---|---|
2018 |
2019 |
2020 |
2021 |
2022 |
2019 |
2020 |
2021 |
2022 |
|
BC |
329 |
402 |
116 |
141 |
156 |
- |
$1,737.61 |
$1,081.14 |
|
AB |
356 |
348 |
39 |
35 |
417 |
- |
$886.21 |
$1, 134.49 |
$744.27 |
SK |
38 |
81 |
22 |
16 |
61 |
$1,709.75 |
$1,863.80 |
$2, 487. 50 |
$1,787.50 |
MB |
98 |
101 |
37 |
0 |
27 |
- |
- |
- |
- |
2,099 |
1,584 |
512 |
923 |
1,165 |
$1,149.71 |
$2,110.14 |
$1, 873. 63 |
$1,884.83 |
|
130 |
276 |
150 |
98 |
44 |
- |
- |
- |
- |
|
NB |
173 |
140 |
11 |
0 |
63 |
- |
$365.00 |
0 |
$1,200.00 |
NS |
350 |
106 |
18 |
- |
28 |
- |
$750.00 |
- |
- |
PEIFootnote 29 |
51 |
2 |
0 |
11 |
10 |
- |
- |
- |
- |
45 |
13 |
9 |
- |
8 |
$131.79 |
- |
$543.37 |
- |
|
YT |
19 |
18 |
2 |
- |
5 |
- |
$3,494.03 |
- |
$1,546.47 |
NT |
32 |
37 |
- |
- |
10 |
$3,000.00 |
- |
$3, 500 |
$3,500.00 |
NU |
6 |
7 |
- |
- |
18 |
- |
- |
- | $6,000.00 |
CANADA |
3,726 |
3,115 |
916 |
1,224 |
2,012 |
- |
- |
- |
- |
CBSA |
- |
567 |
149 |
- |
- |
- |
$2,479.00 |
- |
- |
Including Quebec which trains 100% of its police officers in SFST, there were over 29,000 SFST trained officers overall across the country at the end of 2022, representing 42% of all police officers in the country. The distribution across jurisdictions is as follows:
Province and Territories |
Total # of officers trained in SFST as of December 31 |
% frontline police officers trained in SFST |
||||||
|---|---|---|---|---|---|---|---|---|
2019 |
2020 |
2021 |
2022 |
2019 |
2020 |
2021 |
2022 |
|
BC |
1,445 |
1,560 |
1,701 |
1,970 |
30% |
33% |
35.4% |
41% |
AB |
1,435 |
1,360 |
1,332 |
1,816 |
25% |
24% |
23% |
31% |
SK |
251 |
273 |
289 |
350 |
63% |
68% |
73% |
88% |
MB |
455 |
492 |
492 |
559 |
25% |
28% |
- |
22% |
5,391 |
5,903 |
6,826 |
7,991 |
21% |
- |
26% |
30% |
|
15,388 |
15,462 |
15,544 |
16,251 |
100% |
100% |
100% |
100% |
|
NB |
419 |
430 |
436 |
499 |
41% |
41% |
41% |
47% |
NS |
609 |
627 |
184 |
212 |
90% |
34% |
- |
11% |
PEI |
77 |
77 |
88 |
98 |
39% |
47% |
45% |
|
NL |
244 |
364 |
136 |
144 |
- |
44% |
38.66% |
33% |
YT |
- | 39 |
32 |
45 |
- |
30% |
- |
32% |
NT |
- | 27 |
- |
12 |
- |
18% |
53% |
7% |
NU |
12 |
- |
- |
18 |
- |
- |
- |
11% |
CANADA |
10,338 excl. QC; 25,726 incl. QC | 11,152 excl. QC; 26,614 incl. QC |
11,516 excl. QC; 27,060 Incl. QC |
13,714 excl. QC; 29,965 incl. QC |
- |
- |
- |
- |
CBSA |
- |
716 |
716 |
- |
- |
24% |
50.2% |
- |
The average cost of SFST training varies significantly across jurisdictions from a few hundred dollars to a few thousand. This may depend on such factors as the method of course delivery, geographical location (e.g., need to travel), course duration, class size, etc.
Drug Recognition Expert (DRE) Training and Certification
Drug Recognition Experts (DRE) receive training on the Drug Evaluation Classification (DEC) Program. The DEC is a systematic and standardized 12-step procedure used by trained officers to recognize and evaluate behaviours and physiological indicators associated with the seven different drug categories: central nervous system depressants and stimulants, inhalants, dissociative anesthetics, cannabis, hallucinogens, and narcotic analgesics. The results of the 12-step evaluation, when corroborated by toxicological evidence of drug use, provide sufficient evidence to proceed with DID charges (Porath & Beirness, 2019).
The Criminal Code recognizes the International Association of Chiefs of Police (IACP) DEC Program as the sole approved training for SFST and DRE for Canadian police and, since 2005, the program has been under the stewardship of the RCMP National Traffic Programs and Operational Technologies. The national DEC program is managed by the RCMP which collects yearly statistics on training, certification, and re-certification of officers across Canada. Data from the RCMP national office indicates that320 officers were trained in DRE in 2022, an increase from 39 in 2021 and 91 in 2020. The national total of active DRE officers at the end of 2022 was 911, a reduction from 2020. This now represents almost 73% of the 5-year target (n=1,250) established by the provinces and territories as part of the funding agreements under the federal initiative. Following the inability to hold training and recertification sessions during the COVID-19 pandemic, training was ramped up in 2022 to near pre-pandemic levels and it's expected for the total number of DREs to follow the same trend in the coming years.
Provinces and Territories |
2018 |
2019 |
2020 |
2021 |
2022 |
|---|---|---|---|---|---|
BC |
55 |
63 |
13 |
17 |
30 |
AB |
53 |
76 |
0 |
- |
38 |
SK |
17 |
32 |
0 |
0 |
9 |
MB |
9 |
12 |
0 |
- |
9 |
ON |
123 |
127 |
42 |
- |
142 |
QC |
51 |
32 |
29 |
33 |
46 |
NB |
23 |
11 |
4 |
- |
7 |
NS |
31 |
15 |
6 |
- |
24 |
PEI |
6 |
1 |
1 |
- |
1 |
NL |
9 |
14 |
3 |
- |
14 |
YT |
0 |
1 |
1 |
- |
1 |
NT |
2 |
1 |
0 |
- |
3 |
NU |
0 |
0 |
0 |
0 |
0 |
CANADA |
379 |
385 |
99 |
50 |
324 |
Provinces and Territories |
2020Footnote 33 |
2021 |
2022 |
|---|---|---|---|
BC |
186 |
185 |
119 |
AB |
172 |
160 |
95 |
SK |
80 |
74 |
62 |
MB |
43 |
40 |
36 |
ON |
450 |
390 |
317 |
QC |
163 |
172 |
179 |
NB |
51 |
47 |
37 |
NS |
78 |
67 |
68 |
PEI |
12 |
19 |
16 |
NL |
41 |
36 |
36 |
YT |
2 |
4 |
3 |
NT |
4 |
3 |
0 |
NU |
0 |
0 |
0 |
CANADA |
1,279 |
1,211 |
911 |
Approved Drug Screening Equipment (ADSE)
The Royal Canadian Mounted Police (RCMP) has rolled-out a national master “train-the-trainer” curriculum on the approved drug screeners for police services across the country.
Eleven provinces and territories have purchased and deployed ADSE as follows:
Provinces and Territories |
2018 |
2019 |
2020 |
2021 |
2022 |
Total |
|---|---|---|---|---|---|---|
BC |
15 |
15 |
32 |
- |
0 |
62 |
AB |
6 |
- |
0 |
63 |
0 |
69 |
SK |
0 |
15 |
15 |
44 |
29 |
103 |
MB |
20 |
0 |
0 |
25 |
6 |
51 |
ON |
154 |
24 |
10 |
6 |
0 |
194 |
NS |
5 |
0 |
17 |
15 |
8 |
|
PEI |
- |
5 |
8 |
- |
5 |
18 |
NL |
- |
- |
21 |
23 |
- |
44 |
NT |
2 |
- |
- |
21 |
20 |
43 |
NU |
- |
1 |
- |
13 |
- |
14 |
YK |
- |
- |
6 |
- |
- |
6 |
Total Canada |
202 |
50 |
109 |
210 |
68 |
639 |
While most PTs continue to increase their inventories of ADSE available to officers, challenges persist in many jurisdictions. Some provinces are disincentivized due to the limited scope of detected drugs (only THC and cocaine). Other provinces have indicated that they are waiting for new devices and improved technology to be introduced before procuring more devices.
Law Enforcement Interventions
Collecting data on law enforcement interventions to address DID has been challenging for all jurisdictions for a variety of reasons. When this initiative started in 2017, collecting this data was a new requirement in most instances for law enforcement organizations across the country. As such, there was a need to work closely with provinces and territories to ascertain the feasibility and capacity to collect data on law enforcement interventions in DID cases. Started in late 2018, further to the enactment of cannabis legalization, this work continued well into 2019. Agreement was reached with all jurisdictions in December 2019 on the list of national indicators and data sources. Once agreement was reached on the list of indicators and data sources, jurisdictions needed to develop data collection tools and establish protocols with law enforcement agencies. Given that data collection takes time, and law enforcement priority responsibility is to respond to calls and conduct investigations, discussions with law enforcement agencies on appropriate and efficient ways to collect the required data are ongoing.
Standardized Field Sobriety Testing
Prior to this federal initiative, data on the use (e.g., frequency, circumstances such as day of the week or time of day, and results) of SFST was not collected by police. Given that this tool was available for use by law enforcement since 2009, and that it is in many cases a key detection tool, addressing this absence was a key priority for FPT senior officials and for the FPT working group on DID.
Since 2019, some jurisdictions have started testing the implementation of a log of SFST results. The RCMP and CBSA have also started implementing processes for tracking the administration of the SFST to a driver.
Starting in 2021, significantly more data is available on SFST. Due to a different data collection system used by the RCMP in BC, no data on the use and results of SFST is currently available. In all jurisdictions but Ontario and Quebec, data includes results from both RCMP and non-RCMP (e.g., municipal) police forces, except for the three territories where the RCMP is the only police. The data presented below report all known cases where SFST was used as a screening tool, and reports on poor performance only in cases where drugs are involved. The data are as follows:
2021 |
2022 |
|||||
|---|---|---|---|---|---|---|
# times SFST used |
Poor performance |
Drugs identified |
# times SFST used |
Poor performance |
Drugs identified |
|
Alberta |
123 |
88 (71%) |
- |
Unknown |
184 |
- |
Saskatchewan |
45 |
31 (65%) |
- |
80 |
62 (77%) |
- |
Manitoba |
19 |
13 (68%) |
6 |
11 |
10 (91%) |
6 |
Ontario (OPP only) |
523 |
411 (78%) |
371 |
421 |
331 (79%) |
286 |
Quebec (SQ only) |
767 |
24% |
- |
- | - | - |
New Brunswick |
36 |
17 (47%) |
- |
40 |
16 (40%) |
- |
Nova Scotia |
29 |
- |
- |
42 |
- |
- |
Prince Edward Island |
39 |
38 (97%) |
- |
32 |
8 (25%) |
- |
Newfoundland and LabradorFootnote 35 |
26 |
17 (65%) |
- |
23 |
11 (48%) |
- |
Nunavut |
5 |
2 (40%) |
- |
- |
- |
- |
Northwest Territories |
6 |
2 (33%) |
- |
9 |
3 (33%) |
- |
Yukon |
5 |
4 (80%) |
- |
- |
- |
- |
In New Brunswick, 157 of the 177 SFST trained officers reported never conducting an SFST evaluation in 2022. While this may seem like a potentially concerning trend, the overall reporting rate for officers increased from 25% in 2021 to 35% in 2022.
It is interesting to note the wide variation in the proportion of cases where the driver performed poorly. This is most likely due to the still incomplete reporting of frequency of use and results. Nevertheless, there is clearly significant progress in data coverage across the country.
Drug Recognition Evaluation
The RCMP National DEC program and the Sûreté du Québec in cooperation with the École nationale de police in Quebec collect DRE data. Certified drug recognition experts complete a drug influence evaluation sheet (known as the facesheet), a narrative report, and the DRE report (the tracking form). The facesheet contains large amounts of qualitative information, but none is systematically captured in electronic records. Furthermore, the database is still largely paper-based, and likely incomplete as DRE facesheets may only be transmitted to the data collectors once toxicology reports are completed and collected, which can take months.
Despite a decline in 2022 compared to 2021 (4,317 vs 5,548), the number of DRE evaluations conducted yearly has continuously increased since 2018 (from 2,937 to 4,317). Similarly, there has been a continued increase in the average number of evaluations per DRE officer, and this trend continued in 2022.
Figure 4 – Total Drug Recognition Expert (DRE) Operational Evaluations (annual)
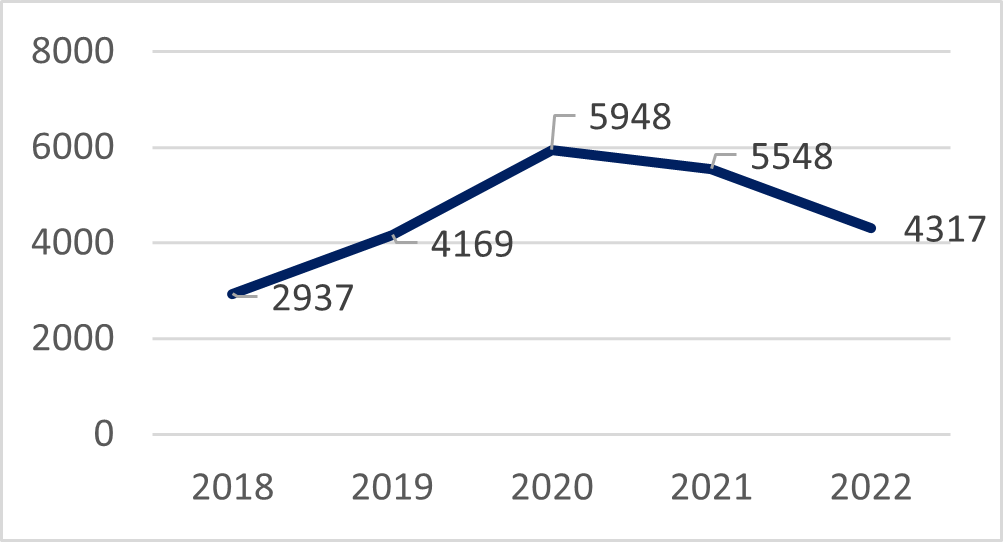
Image description
| Year | Total DRE Operational Evaluations |
|---|---|
2018 |
2,937 |
2019 |
4,169 |
2020 |
5,948 |
2021 |
5, 548 |
2022 |
4,317 |
Figure 5 – Average Number of Evaluations per DRE (annual)
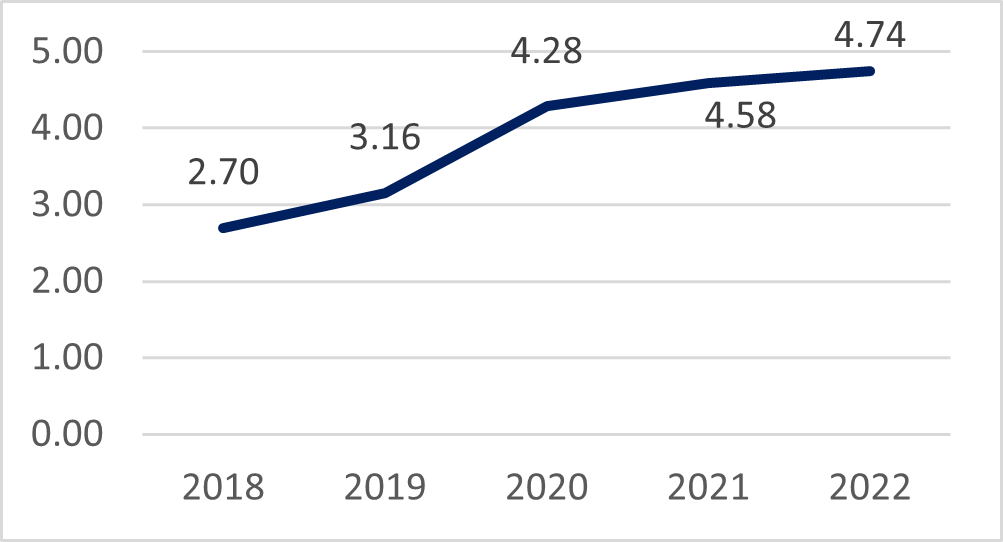
Image description
| Year | Average Evaluations per DRE |
|---|---|
2018 |
2.70 |
2019 |
3.16 |
2020 |
4.28 |
2021 |
4.58 |
2022 |
4.74 |
Most opinion categoriesFootnote 36 saw a decrease in 2022 compared to 2021. However, cannabis as an opinion category decreased from 1,136 to 975, and is in third position, behind stimulants and narcotics analgesics. Figure 4 below displays the DRE opinion categories for 2022 and the following tables present the detailed results for each year.
Figure 6 – DRE Evaluations: Frequency of Opinion Categories, Canada, 2022
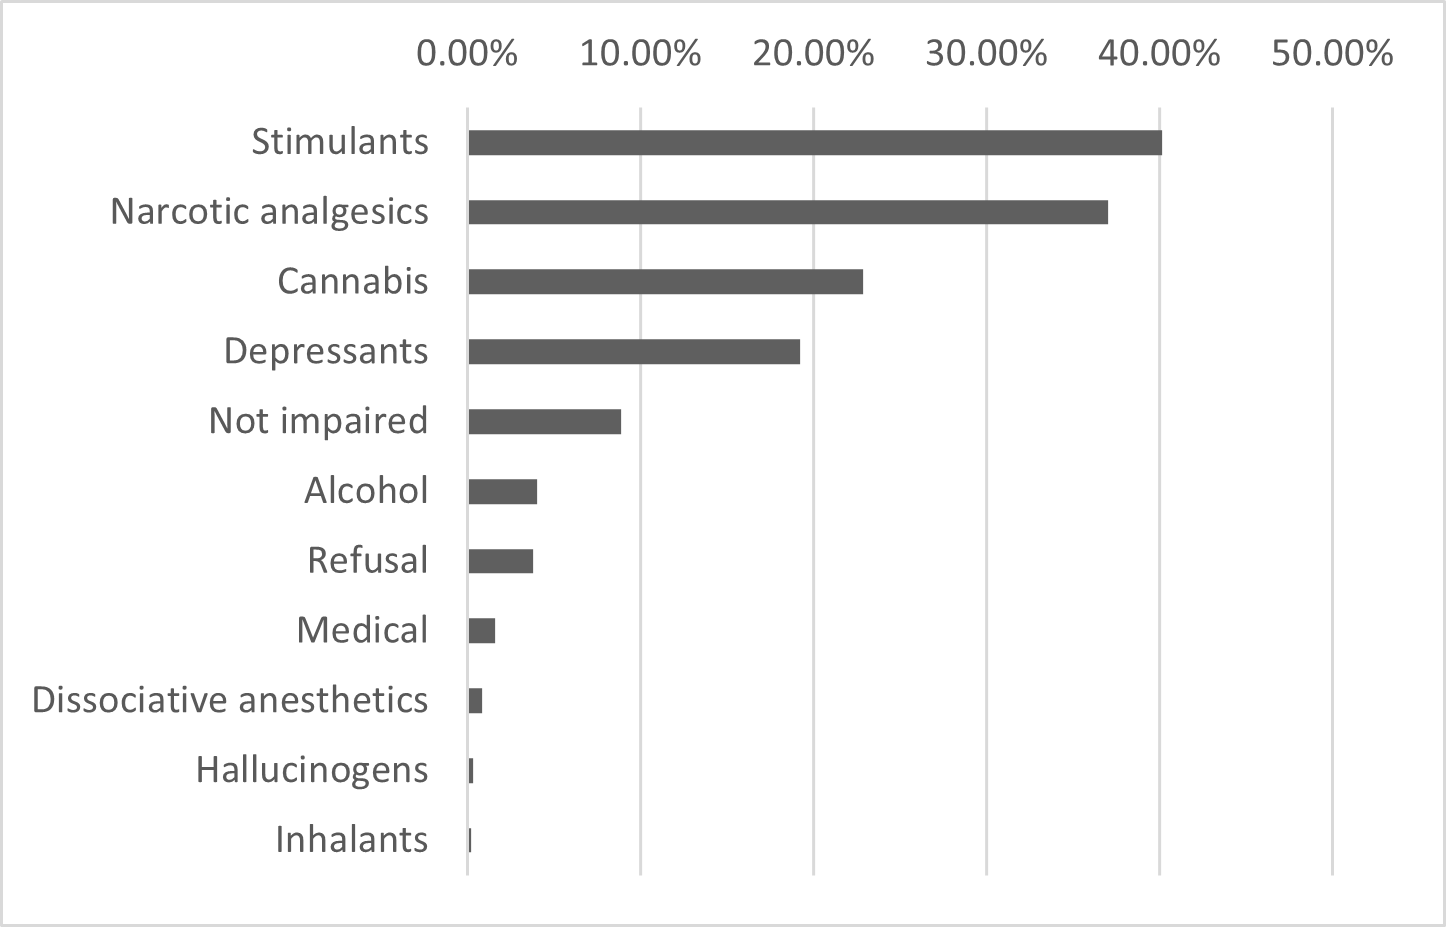
Image description
Opinion Categories |
Frequency (%) |
|---|---|
Stimulants |
40.14% |
Narcotic analgesics |
37.03% |
Cannabis |
22.85% |
Depressants |
19.24% |
Not impaired |
8.89% |
Alcohol |
4.00% |
Refusal |
3.79% |
Medical |
1.62% |
Dissociative anesthetics |
0.83% |
Hallucinogens |
0.34% |
Inhalants |
0.21% |
It is important to note that the tables below represent the total number of times the drug category was opined during an evaluation, not the total number of occurrences. Additionally, there can be multiple categories opined per individual occurrence.
BC |
AB |
SK |
MB |
ON |
NB |
NS |
PEI |
NFLD |
YK |
NWT |
NU |
Total |
||
|---|---|---|---|---|---|---|---|---|---|---|---|---|---|---|
Depressants |
111 |
76 |
34 |
18 |
100 |
22 |
32 |
7 |
29 |
0 |
0 |
0 |
429 |
|
Stimulants |
247 |
66 |
25 |
9 |
87 |
NR |
15 |
15 |
5 |
15 |
0 |
0 |
0 |
484 |
Hallucinogens |
0 |
0 |
2 |
0 |
4 |
NR |
0 |
1 |
0 |
1 |
0 |
0 |
0 |
8 |
Dissociative Anesthetics |
4 |
1 |
1 |
1 |
4 |
NR |
0 |
0 |
0 |
0 |
0 |
0 |
0 |
11 |
Narcotic Analgesics |
199 |
69 |
32 |
6 |
100 |
NR |
28 |
20 |
15 |
13 |
1 |
0 |
0 |
483 |
Cannabis |
113 |
95 |
28 |
12 |
120 |
NR |
22 |
35 |
7 |
18 |
0 |
1 |
0 |
451 |
Inhalants |
1 |
0 |
0 |
0 |
1 |
NR |
0 |
0 |
0 |
0 |
1 |
0 |
0 |
3 |
Medical |
9 |
1 |
2 |
0 |
6 |
NR |
1 |
4 |
1 |
2 |
0 |
0 |
0 |
26 |
Alcohol |
14 |
8 |
7 |
1 |
15 |
NR |
4 |
9 |
0 |
7 |
0 |
0 |
0 |
65 |
Not Impaired |
25 |
40 |
6 |
6 |
66 |
NR |
16 |
16 |
6 |
9 |
1 |
0 |
0 |
191 |
Refusal |
28 |
36 |
1 |
4 |
8 |
NR |
1 |
3 |
0 |
1 |
0 |
0 |
0 |
82 |
BC |
AB |
SK |
MB |
ON |
QC |
NB |
NS |
PEI |
NFLD |
YK |
NWT |
NU |
Total |
|
|---|---|---|---|---|---|---|---|---|---|---|---|---|---|---|
Depressants |
167 |
84 |
12 |
15 |
222 |
388 |
12 |
24 |
3 |
18 |
0 |
0 |
0 |
945 |
Stimulants |
329 |
86 |
19 |
7 |
260 |
499 |
13 |
12 |
2 |
10 |
1 |
0 |
0 |
1,238 |
Hallucinogens |
4 |
0 |
0 |
0 |
1 |
7 |
0 |
0 |
0 |
0 |
0 |
0 |
0 |
12 |
Dissociative Anesthetics |
6 |
0 |
0 |
0 |
10 |
13 |
1 |
2 |
0 |
0 |
0 |
0 |
0 |
32 |
Narcotic Analgesics |
279 |
68 |
15 |
1 |
346 |
90 |
21 |
21 |
7 |
17 |
1 |
0 |
0 |
866 |
Cannabis |
187 |
79 |
17 |
6 |
277 |
299 |
28 |
51 |
8 |
16 |
0 |
0 |
0 |
968 |
Inhalants |
1 |
1 |
1 |
1 |
3 |
7 |
0 |
0 |
0 |
0 |
1 |
0 |
0 |
15 |
Medical |
8 |
4 |
3 |
NR |
34 |
NR |
3 |
NR |
1 |
2 |
0 |
0 |
0 |
55 |
Alcohol |
33 |
7 |
4 |
1 |
27 |
NR |
1 |
NR |
NR |
0 |
0 |
0 |
0 |
73 |
Not Impaired |
28 |
29 |
9 |
8 |
278 |
227 |
19 |
60 |
7 |
11 |
0 |
1 |
0 |
677 |
Refusal |
20 |
29 |
3 |
NR |
45 |
32 |
5 |
11 |
NR |
0 |
0 |
0 |
0 |
145 |
Poly Category |
356 |
28 |
12 |
NR |
433 |
247 |
21 |
23 |
6 |
17 |
1 |
0 |
0 |
1,144 |
BC |
AB |
SK |
MB |
ON |
QC |
NB |
NS |
PEI |
NFLD |
YK |
NWT |
NU |
Total |
|
|---|---|---|---|---|---|---|---|---|---|---|---|---|---|---|
Depressants |
219 |
55 |
39 |
9 |
371 |
441 |
27 |
33 |
6 |
40 |
- |
0 |
0 |
1,240 |
Stimulants |
541 |
85 |
52 |
11 |
474 |
591 |
41 |
18 |
15 |
22 |
- |
0 |
0 |
1,850 |
Hallucinogens |
0 |
1 |
0 |
1 |
9 |
13 |
0 |
0 |
0 |
0 |
- |
0 |
0 |
24 |
Dissociative Anesthetics |
7 |
1 |
0 |
0 |
22 |
27 |
1 |
1 |
0 |
0 |
- |
0 |
0 |
59 |
Narcotic Analgesics |
497 |
108 |
38 |
9 |
829 |
86 |
35 |
34 |
11 |
27 |
- |
0 |
0 |
1,674 |
Cannabis |
205 |
74 |
61 |
11 |
445 |
356 |
32 |
24 |
13 |
28 |
- |
0 |
0 |
1,249 |
Inhalants |
1 |
0 |
0 |
0 |
6 |
1 |
0 |
0 |
0 |
0 |
- |
0 |
0 |
8 |
Medical |
21 |
5 |
2 |
NR |
49 |
21 |
5 |
0 |
1 |
0 |
- |
0 |
0 |
104 |
Alcohol |
21 |
20 |
15 |
0 |
30 |
157 |
5 |
9 |
0 |
0 |
- |
0 |
0 |
257 |
Not Impaired |
56 |
52 |
33 |
6 |
380 |
217 |
30 |
11 |
9 |
13 |
- |
0 |
0 |
807 |
Refusal |
NR |
37 |
0 |
NR |
106 |
65 |
6 |
4 |
0 |
5 |
- |
0 |
0 |
223 |
Poly Category |
541 |
26 |
31 |
9 |
865 |
334 |
42 |
32 |
15 |
33 |
NR |
0 |
0 |
1,928 |
BC |
AB |
SK |
MB |
ON |
QC |
NB |
NS |
PEI |
NFLD |
YK |
NWT |
NU |
Total |
|
|---|---|---|---|---|---|---|---|---|---|---|---|---|---|---|
Depressants |
224 |
60 |
14 |
5 |
503 |
380 |
19 |
25 |
14 |
15 |
1 |
NR |
NR |
1,260 |
Stimulants |
668 |
58 |
17 |
2 |
847 |
519 |
36 |
17 |
10 |
21 |
7 |
NR |
NR |
2,202 |
Hallucinogens |
4 |
1 |
0 |
1 |
6 |
7 |
0 |
1 |
0 |
1 |
0 |
NR |
NR |
21 |
Dissociative Anesthetics |
7 |
1 |
0 |
0 |
15 |
8 |
0 |
0 |
0 |
1 |
0 |
NR |
NR |
32 |
Narcotic Analgesics |
713 |
131 |
47 |
7 |
1,278 |
98 |
26 |
22 |
14 |
18 |
8 |
NR |
NR |
2,362 |
Cannabis |
222 |
43 |
32 |
7 |
524 |
233 |
21 |
27 |
11 |
22 |
2 |
NR |
NR |
1,144 |
Inhalants |
0 |
0 |
0 |
0 |
5 |
5 |
0 |
4 |
0 |
0 |
- |
NR |
NR |
14 |
Medical |
7 |
7 |
0 |
0 |
28 |
25 |
4 |
2 |
0 |
3 |
0 |
NR |
NR |
76 |
Alcohol |
20 |
2 |
3 |
1 |
30 |
81 |
2 |
3 |
1 |
2 |
0 |
NR |
NR |
145 |
Not Impaired |
47 |
25 |
4 |
3 |
316 |
152 |
13 |
18 |
14 |
23 |
1 |
NR |
NR |
616 |
Refusal |
47 |
28 |
4 |
1 |
106 |
45 |
8 |
NR |
1 |
4 |
1 |
NR |
NR |
245 |
Poly Category |
701 |
25 |
30 |
4 |
1007 |
240 |
26 |
19 |
10 |
47 |
7 |
NR |
NR |
2,152 |
BC |
AB |
SK |
MB |
ON |
QC |
NB |
NS |
PEI |
NFLD |
YK |
NWT |
NU |
Total |
|
|---|---|---|---|---|---|---|---|---|---|---|---|---|---|---|
Stimulants |
398 |
90 |
19 |
7 |
640 |
490 |
27 |
20 |
9 |
17 |
1 |
5 |
0 |
1,723 |
Narcotic Analgesics |
416 |
111 |
25 |
5 |
857 |
105 |
24 |
18 |
15 |
16 |
6 |
1 |
0 |
1,599 |
Cannabis |
112 |
49 |
27 |
10 |
418 |
277 |
16 |
27 |
18 |
29 |
1 |
1 |
0 |
985 |
Depressants |
133 |
54 |
12 |
1 |
307 |
257 |
14 |
25 |
2 |
21 |
1 |
2 |
0 |
831 |
Not Impaired |
10 |
30 |
14 |
1 |
253 |
4 |
26 |
18 |
16 |
12 |
0 |
0 |
0 |
384 |
Alcohol |
16 |
1 |
1 |
0 |
40 |
102 |
2 |
1 |
0 |
1 |
0 |
0 |
0 |
164 |
Refusal |
8 |
20 |
2 |
1 |
73 |
38 |
12 |
0 |
0 |
6 |
0 |
0 |
0 |
160 |
Medical |
4 |
2 |
2 |
0 |
29 |
19 |
5 |
8 |
0 |
1 |
0 |
0 |
0 |
70 |
Dissociative Anesthetics |
3 |
2 |
1 |
0 |
15 |
15 |
0 |
0 |
0 |
0 |
0 |
0 |
0 |
36 |
Hallucinogens |
1 |
1 |
0 |
0 |
11 |
2 |
0 |
0 |
0 |
0 |
0 |
0 |
0 |
15 |
Inhalants |
1 |
0 |
1 |
0 |
6 |
1 |
0 |
0 |
0 |
0 |
0 |
0 |
0 |
9 |
Poly Category |
424 |
105 |
31 |
3 |
726 |
218 |
30 |
17 |
6 |
21 |
6 |
1 |
0 |
1,588 |
Approved Drug Screening Equipment
As mentioned earlier, eleven jurisdictions have procured ADSE since their approval, but not all have actually used them. Data on the use of ADSE by law enforcement for 2022 was reported by seven provinces (Alberta, Saskatchewan, Manitoba, Ontario, Nova Scotia, PEI, and Newfoundland and Labrador)Footnote 40:
- Alberta: used 77 times, 69 positive (90%);
- Saskatchewan: 933 times, 721 positive (77%)
- Manitoba: used 102 times, 86 (84%) positive for cannabis alone or in combination with cocaine
- Ontario: used 11 times, 7 (64%) positiveFootnote 41
- Nova Scotia: ADSE were used 47 times, however the results are unknown;
- PEI: used 64 times , 63 (98%) positive
- Newfoundland and Labrador: the RCMP used ADSE 21 times, 20 positive (95%)
There appears to be an increasing level of use of ADSE in provinces that have procured the devices. The proportion of positive results (i.e., an impairing drug detected above authorized levels) ranged from 61% to almost 100%.
Blood Analyses
Data on the number of times blood samples were demanded in cases involving suspected DID was provided by the RCMP where it delivers provincial or municipal police services (all but Ontario and Quebec). Data for 2021 are lower due to the fact that toxicology laboratories were focusing their resources on the COVID-19 pandemic. Additionally, given lack of resources and time to obtain results, it is likely that a significant amount of data may be missing.
Table 18 below displays the total number of blood analysis requested by type of analysis, and the number of toxicological results received from the RCMP labs only (excludes the Ontario and Quebec labs). In many cases, the toxicological analysis result reports are unavailable.
Alcohol and Drug Analysis Requested |
Drug Only Analysis Requested |
Total |
|||||||
|---|---|---|---|---|---|---|---|---|---|
2019 |
2020 |
2021 |
2019 |
2020 |
2021 |
2019 |
2020 |
2021 |
|
BC |
48 |
47 |
18 |
63 |
60 |
41 |
111 |
107 |
59 |
AB |
56 |
55 |
7 |
122 |
122 |
20 |
178 |
177 |
27 |
SK |
33 |
19 |
6 |
28 |
24 |
22 |
61 |
43 |
28 |
MB |
23 |
27 |
9 |
56 |
33 |
10 |
79 |
60 |
19 |
NB |
17 |
18 |
4 |
8 |
8 |
7 |
25 |
26 |
11 |
NS |
8 |
9 |
7 |
51 |
11 |
18 |
59 |
20 |
25 |
PE |
5 |
3 |
0 |
18 |
19 |
6 |
23 |
22 |
6 |
NL |
6 |
8 |
6 |
9 |
12 |
14 |
15 |
20 |
20 |
YT |
1 |
1 |
0 |
0 |
0 |
1 |
1 |
1 |
1 |
NU |
1 |
0 |
0 |
0 |
0 |
0 |
1 |
0 |
0 |
NT |
0 |
0 |
0 |
0 |
1 |
0 |
0 |
1 |
0 |
Total |
198 |
187 |
57 |
355 |
290 |
139 |
553 |
477 |
196 |
In Manitoba, blood draw demands are being employed by police agencies upon suspicion of drug impaired driving. Data was available for all police agencies other than the Winnipeg Police Service. Below is a summary of blood draw demands from Manitoba along with results received to date.
Year |
TOTAL Blood Draws |
Toxicology ResultsFootnote 43 |
|||||||
|---|---|---|---|---|---|---|---|---|---|
THC |
Cocaine |
Meth |
Other |
Refusal |
N/AFootnote 44 |
Alcohol |
Pending |
||
2018 |
17 |
8 |
4 |
4 |
3 |
1 |
3 |
0 |
0 |
2019 |
50 |
24 |
6 |
8 |
4 |
2 |
3 |
5 |
8 |
2020 |
37 |
10 |
2 |
4 |
3 |
0 |
4 |
3 |
13 |
2021 |
18 |
10 |
1 |
2 |
1 |
1 |
1 |
1 |
3 |
2022 |
104 |
5 |
0 |
1 |
2 |
5 |
3 |
28 |
62 |
In Newfoundland and Labrador, the RCMP requested 17 blood sample analysis in 2022. Out of the 11 samples analyzed, 10 returned positive results for cannabis alone, the remaining 6 samples are pending analysis.
The province of Quebec undertake their own blood or urine sample testing through the Laboratoire de sciences judiciaires et de médecine légale du Quebec (LSJML). In 2022, 560 samples were analyzed to completion with 96% urine samples and 4% blood draws. The vast majority of samples (97%) returned positive results for at least one drug; however, cannabis was only the fourth most prevalent drug, turning in 43 positive results (down from 109 in 2021). While over half (52%) of the 543 positive results showed poly-substance use, only 9.3% of cannabis cases (4 samples of 43) involved poly-substance use.
Results
Charges Footnote 45
Statistics Canada's 2021 Juristat article on Impaired Driving (Perreault, 2021) indicates that the rate of all impaired driving incidents cleared by charge is generally declining: it was 94% in 1989, about 71% in 2015, 63% in 2018, and 56% in 2019. An even smaller proportion of DID incidents are cleared by charge: 57% in 2018 and 49% in 2019. This may be due in part to increased use of administrative sanctions in alcohol-impaired driving cases as opposed to criminal charges, as well as the challenges associated with investigating and prosecuting a DID offence, as previously discussed.
Given that the Act legalizing cannabis was only adopted in the later part of 2018 and that bringing charges to prosecution may be a long process, data presented below from provincial and territorial annual reports for 2022 may not reflect the full extent of the DID charges. The DID charges being analysed in this section include: 320.14(1)(a), (c), (d), and 320.14(4). Furthermore, and most importantly, PT data on 320.14(1)(a) includes cases of alcohol impaired driving, which obviously skews the findings. Data provided by jurisdictions for 2022 is as follows:
- In Alberta, 196 charges were laid under 320.14(1)(a), (c), (d), or 320.14(4).
- In Saskatchewan, 2,530 charges were laid under 320.14(1)(a), (c), (d), or 320.14(4).
- In Manitoba, 124 charges were laid under 320.14(1)(a), (c), (d), or 320.14(4).
- In Ontario 13,197 charges were laid under 320.14(1)(a), (c), (d), or 320.14(4).
- In New Brunswick, 54 total charges were laid under 320.14(1)(a), (c), (d), or 320.14(4), 39 of which were on behalf of the RCMP.
- In Nova Scotia, 1,525 charges were laid under 320.14(1)(a), (c), (d), or 320.14(4).
- In Newfoundland and Labrador, the RCMP laid 37 charges under 320.14(1)(a), (c), (d), or 320.14(4).
- In Nunavut, 124 charges laid under 320.14(1)(a), (c), (d) or 320.14(4).
- Of the 258 occurrences in which impaired driving charges were laid in the Northwest Territories, only one was for drug impaired driving. In the Yukon, a total of 539 charges were laid for impaired driving in 2022; 59 (10.9%) were operation while impaired (alcohol and drugs), and 39 (7.2%) were for operation while impaired (drugs).
Youth Charged with Impaired Driving
The CCSA commissioned a study to examine the impacts of cannabis legalization on youth, and vulnerable youth in particular.Footnote 46 One of the elements examined was drug-impaired driving.
The authors conducted an analysis using Statistics Canada data, the authors examining charges related to driving while impaired on drugs. Pre-legalization charges included operation of a vehicle while impaired by drugs. Post-legalization charges included: 1) operation of a vehicle while impaired by drugs; 2) operation of a vehicle while impaired by drugs and alcohol; and 3) operation of a vehicle while impaired (unspecified).
The data indicate that driving while impaired charges (note that this includes all drugs, not just cannabis, as well as the combination of alcohol and drugs) in Canada, increased significantly after cannabis legalization. In 2015, only 2,549 impaired charges were issued. By 2019, this figure had risen to 11,958 charges, an increase of 369%.
Age Group |
YEAR |
Percent Change |
|||
|---|---|---|---|---|---|
2015 |
2016 |
2017 |
2019 |
2015-2019 |
|
12-17 yrs |
54 |
54 |
58 |
127 |
135.20% |
18-24 yrs |
572 |
680 |
695 |
2,052 |
258.70% |
25-34 yrs |
806 |
937 |
1,061 |
3,781 |
369.10% |
35+ yrs |
1,117 |
1,210 |
1,289 |
5,998 |
437.00% |
Total |
2549 |
2881 |
3103 |
11958 |
369.10% |
All provinces and territories, except for the Yukon and Nunavut, experienced a significant post-legalization rise in DID charges.Footnote 48 However, the magnitude of this increase varied dramatically by region and age group. Three provinces (Newfoundland and Labrador, New Brunswick and Manitoba) experienced increases of less than 100%. Five regions (Prince Edward Island, Quebec, Saskatchewan, British Columbia and the Northwest Territories) experienced increases of between 100% and 200%. Two provinces (Nova Scotia and Alberta) experienced increases in impaired charges between 200% and 500%. Ontario experienced – by far -- the greatest post-legalization increase in impaired driving charges: from only 439 cases in 2015 to 6,334 cases in 2019; this represents a 1,342% increase in driving while impaired (on drugs) charges over this five-year period.
Youth 12-17 years represent a small minority of those charged with driving while impaired offences (less than 3% across the study period). While they also experienced a significant increase in impaired-driving charges following cannabis legalization, the increase was far less than for older adults. In 2015, prior to cannabis legalization, only 54 impaired driving charges were laid against young offenders. This figure rises to only 127 charges in 2019 – a 135% increase. In comparison, the rate increased by 258% for young people aged 18-24.
Only seven of the thirteen provinces and territories – PEI, Nova Scotia, Quebec, Ontario, Manitoba, Alberta, and the Northwest Territories -- experienced a post-legalization increase in youth impaired driving charges. All other regions remained stable or experienced a post-legalization decline. Post-legalization, the Northwest Territories has the highest youth impaired driving charge rate (59.1 per 100,000). Prince Edward Island, Nova Scotia, Quebec, and Alberta also have a post-legalization youth charge rate above the national average (5.2 per 100,000). The charge rates for all other provinces and territories fall below the national average
Convictions
Over the period examined in Statistics Canada's 2019 Juristat on impaired driving (2010/11 to 2018/19) (Perreault, 2021) DID cases (64%) were less likely to result in a guilty finding (whether by plea or decision) than alcohol-impaired driving incidents (82%). However, the proportion of DID cases resulting in a guilty finding has risen over the same period from 64% in 2010/11 to 70% in 2018/19.
Given the length of time required to process DID charges in court (median of 115 days in 2018-2019; Perreault, 2021), few jurisdictions presented data on convictions for DID cases in their annual report, and it was incomplete in most cases. One of the factors contributing the lower proportion of DID incidents resulting in a guilty finding compared to alcohol impaired driving cases is the amount of time it takes to complete an investigation (including getting toxicology results). It is very rare for a case to be completely adjudicated in the same year that the offence occurred, except in cases where a guilty plea is entered. The longer processing time for DID cases means that many cases will be adjudicated in the following year and may still result in a finding of guilt.
It should also be noted that convictions under 320.14(a) include a number of cases (likely the majority) where alcohol was also involved.
Court data compiled by jurisdictions for 2022 is as follows:
- In Alberta, there were 40 convictions under section 320.14(a), (c), or (d), with a 20.4% conviction rate.
- In Saskatchewan, there were 619 convictions under section 320.14(a), (c), or (d), with a 24% conviction rate.
- In Ontario, out of a total of 7,652 cases, there were 4,848 cases where the accused entered a plea of guilt, or was found guilty under sections 320.14(a), (c), or (d), for a conviction rate of 63%.Footnote 49
- In Nova Scotia, there were 213 convictions under section 320.14(a), (c), or (d), with a 12% conviction rate.
- In Newfoundland and Labrador, there were 4 convictions under section 320.14(a), (c), or (d), and 4 other convictions under 320.15(1) (refusal to comply).
- In Nunavut, there were 40 total convictions for both alcohol and drug-impaired driving charges.
- In NWT, there were 15 guilty convictions, all under 320.14(1)(a).
Penalties and Sentences
The Juristat on impaired driving (Perreault, 2021:21) indicates that over the 9-year period from 2010 to 2019, the sentences most often imposed for impaired driving were fines and driving prohibitions, with the average dollar value of fines for DID cases being slightly lower than for alcohol-impaired driving cases.
The following jurisdictions provided data on sentences and administrative sanctions imposed under either the criminal or administrative regime in 2022:
- BC reported 15,507 administrative alcohol and drug related driving prohibitions in 2022. 90-day immediate roadside prohibitions account for 61% of all driving prohibitions.
- In Alberta, 30 convictions resulted in a prison sentence, 11 in a fine, and 16 probational orders.
- In Saskatchewan 64 received a custodial sentence, 549 fines, 291 probational orders, and 614 driving suspensions. Additionally, in 2022, over 3,000 individuals completed educational programs on addiction and impaired driving.
- In Ontario, fines remained the most serious sentence imposed, making up 71% of all sentencing cases, while custody alone represented 6% of all sentences in 2022. In total, 299 were sentenced to custody, and 3,456 were sentenced to fine. Furthermore, there were 1,740 administrative sanctions imposed on drivers relating to drug-impaired driving.
Type of Suspension |
Description |
Total |
||||
|---|---|---|---|---|---|---|
2018 |
2019 |
2020 |
2021 |
2022 |
||
Administrative Driver's Licence Suspension |
90-day licence suspension for those detected driving with BAC > 0.08% |
12,644 |
13,473 |
12,277 |
12,908 |
14,441 |
Suspend Driver Warn Range BAC |
3, 7, or 30-day licence suspension for those detected with BAC > 0.05% |
7,287 |
6,683 |
4,904 |
4,946 |
5,197 |
90-day ADLS - DRE |
90-day suspension for those found to be impaired by drugs by a Drug Recognition Expert/Evaluator |
864 |
1,230 |
2,197 |
2,555 |
1,506 |
Short Term - SFST |
3, 7, 30-day license suspension for drivers who fail the SFST at roadside |
165 |
140 |
111 |
179 |
114 |
Zero BAC Admin Suspension - Novice |
3, 7, 30-day suspension for Novice drivers with presence of alcohol |
301 |
526 |
542 |
638 |
693 |
Zero BAC Admin Suspension - Under 22 Years |
3, 7, 30-day suspension for young (<22 years) non-novice drivers with presence of alcohol |
63 |
139 |
108 |
89 |
171 |
Zero Drug Admin Suspension - Novice |
3, 7, 30-day suspension for Novice drivers with presence of drugs detected via approved drug screening equipment* |
6 |
63 |
104 |
110 |
77 |
Zero Drug Admin Suspension - Under 22 Years |
3, 7, 30-day suspension for young (< 22 years) non-novice drivers with presence of drugs detected via approved drug screening equipment* |
6 |
15 |
16 |
15 |
25 |
Zero BAC Admin Suspension - Commercial |
3-day suspension for commercial drivers with presence of alcohol |
43 |
110 |
103 |
97 |
137 |
Zero Drug Admin Suspension - Commercial |
3-day suspension for commercial drivers with presence of drugs as detected by approved drug screening equipment* |
4 |
11 |
20 |
26 |
18 |
Total |
21,383 |
22,390 |
20,382 |
21,563 |
22,361 |
|
*Note: Approved drug screen equipment was first approved by the federal Minister of Justice on August 22, 2018.
- In Quebec, 3,699 license suspensions were issued, though it should be noted the majority were under section 320.14(a). Additionally, there were 829 vehicles impounded by a peace officer under article 290.2.1.1 (covering alcohol-impairment, drug-impairment, or refusal to comply). In 2022, a 90-day license suspension due to cannabis, other drugs, or cannabis and other drugs or alcohol was imposed in 898 cases (SAAQ, 2023b). This is a slight increase from 2021 (891), but a reduction compared to 2019 (1,065) and 2020 (1,184).
- Nova Scotia administered 194 license suspensions, 178 fines, 27 instances where the perpetrator was taken into custody, 47 probational orders, and 12 conditional sentences.
- New Brunswick administered 91 license suspensions for drug-impaired driving.
- The Northwest Territories issued 576 license suspensions in 2022 for alcohol or drug-impaired driving.
- In Yukon, the most common sentence for alcohol/drug driving convictions was 1-2 years driving prohibitions and fines ranging from $1000 to $3000. There were 134 fines imposed, 51 custodial sentences, 41 conditional and suspended sentences, 18 probation orders, and 9 other court outcomes.
Charter Challenges
On January 14, 2022, a Nova Scotia Judge rendered a decision on two separate cases violating the per se limits, determining that they do not violate the Canadian Charter of Rights and Freedoms. On November 16, 2022, Justice Bodurtha of the Supreme Court of Nova Scotia found that the authority is well established for roadside screening where the charter s. 10(b) charter violation is justifiable under s. 1 of the charter and also found that roadside screening searches do not violate s. 8 of the charter as they are reasonable. (2022 NSSC 333 (CanLII) | Gray vs. Nova Scotia (Attorney General) | CanLII). A trial continuation is scheduled for September of 2023 in a case challenging the presence of drugs in oral fluid.
Analysis and Conclusions
In most jurisdictions across Canada, data sources (population surveys, roadside surveys, police-reported incidents, as well as coroners' toxicological analyses) tend to indicate an ongoing trend over the past 10-12 years of DID incidents increasing as a proportion of all impaired-driving incidents, with cannabis being one the most frequently detected class of drug among drivers.
On one hand, there are some concerning indicators. Cannabis users, especially daily or almost daily users, are more likely to think that cannabis use does not impair driving. In addition, despite increased public awareness campaigns and new and enhanced tools for police to enforce DID laws, only 25% of Canadians believe that it is very likely that they will get caught if they drive under the influence of cannabis. And while police-reported data show a significant decline in the overall number of impaired driving incidents over the past ten years, the proportion of DID incidents reported by police has significantly increased from about 2% of the total in 2009, to approximately 8% in 2021. It is possible that the increase in the proportion of police-reported DID incidents may be related more to enhanced awareness, and the increase in training and new detection and investigation capacities among law enforcement personnel, than to trends in the actual behaviour of driving after cannabis and/or other drug use. Another preoccupying result was provided by the Brubacher study showing an increased prevalence of injured drivers with levels of THC in blood at or higher than prescribed levels following legalization. Future years of data in self-reported and detected behaviour may help determine if there is indeed an increase in actual drug-driving behaviour.
On the other hand, survey data tend to indicate that public education and awareness campaigns conducted nationally by Public Safety Canada and in provinces and territories may have contributed to changing Canadians' perceptions around driving after cannabis use, with an increasing number of respondents agreeing that cannabis use impairs driving abilities. However, the proportion of Canadians reporting driving after cannabis use has remained stable in 2022.
Whether the current levels of law enforcement capacity to effectively detect and deter DID are sufficient cannot be determined. Nevertheless, despite the COVID-19 pandemic halting progress in 2020, there has been a significant increase in law enforcement capacity building through enhanced training in SFST, DRE and the use of ADSE. There is over 29,000 officers trained in SFST, and data on its use is now collected by more jurisdictions than in previous years, showing significant results at screening drivers who may have recently used cannabis. Eleven of thirteen jurisdictions have now procured ADSEs and their use is increasing, yielding generally high correlation with further investigations of drivers whether through blood sample analysis or a DRE. It can be expected that their use will continue increasing as law enforcement becomes more and more familiar with these tools. Data indicates that there were close to 1,000 active DREs in 2022, compared to 1,279 in 2020 and 1,211 in 2021. This reduction is likely attributable to the impacts of the COVID pandemic on training. While the total number of evaluations conducted in 2022 decreased from 2021 (4,317 vs 5,548), their number has doubled since 2018. The proportion of DRE category opinions is variable but tends to be higher for “drugs” in general than for cannabis specifically.
Furthermore, available data indicate that these tools are highly reliable: when a DRE and/or blood sample are requested further to a failed SFST, there tends to be a high level of correlation (i.e., a poor result on SFST tends to be confirmed by a DRE and/or blood analysis).
Given that processing time for DID court cases tends to be significantly longer than in alcohol-impaired driving, data on charges and their results remains preliminary. There is a long-standing and continuing trend where charges are laid more frequently and lead to higher levels of convictions for alcohol than for DID cases. There also appears to be a trend where administrative penalties under provincial/territorial legislation may be used more often than proceeding with criminal charges. However, future year data and additional analyses will be required to validate these early trends.
Finally, work is continuing at the FPT table and with key stakeholders such as the Canadian Association of Chiefs of Police to further improve the completeness and accuracy of available data.
References
Brubacher, J.R., et. al. (2019) Cannabis use as a risk factor for causing motor vehicle crashes: a prospective study
Conseil canadien des administrateurs en transport motorisé (2019) A Compilation of Jurisdictional Roadside Surveys Conducted prior to Cannabis Legalization. (anglais seulement) Ottawa.
Compton, R. (2017) Marijuana-impaired driving: A report to Congress. Washington, National Highway Traffic Safety Administration.
Owusu-Bempah, A., Wortley, S. and Schlapak, R., (2021) What's changed? Cannabis Legalization and Youth Contact with the Justice System. Ottawa: Canadian Centre on Substance Use and Addictions.
Moreau, G. (2021) Police-Reported Crime Statistics in Canada, 2020. Statistics Canada
Perreault, S. (2021) Impaired Driving in Canada, 2019. Statistics Canada.
Perreault, S. (2016) Impaired Driving in Canada. Statistics Canada, Statistics Canada.
Porath-Waller, A.J. et D.J. Beirness (2014) « An examination of the validity of the Standardized Field Sobriety Test in detecting drug impairment using data from the Drug Evaluation and Classification Program. » Traffic Injury Prevention, 15, 125-131.
Porath, A.J. et D.J. Beirness (2019) « Predicting categories of drugs used by suspected drug-impaired drivers using the Drug Evaluation and Classification Program Tests. » Traffic Injury Prevention.
Robertson, R.D. et coll. (2017) « Prevalence and Trends of Drugged Driving in Canada. » Accident Analysis and Prevention. Vol.99, partie A.
- Date modified: