Patterns in Cannabis Cryptomarkets in Canada in 2018
 PDF Version (1.3 MB)
 by David Décary-Hétu, Masarah Paquet-Clouston, Martin Bouchard, and Carlo Morselli
Abstract
The internet has evolved into a distribution channel for the illicit sale of drugs. Since 2011, criminal entrepreneurs have taken advantage of anonymous online marketplaces, called cryptomarkets. These platforms facilitate transactions of illegal products and services among many sellers and buyers, leveraging sophisticated technologies, like the Tor network and cryptocurrencies, to ensure anonymity among all participants. Illicit drugs are the most common products sold on cryptomarkets, but other goods and services are also offered, such as stolen financial information and counterfeit products. Cryptomarkets represent a low-risk environment where transactions can take place in an organized manner. The main objective of this report is to understand the illicit cannabis trade by Canadians on cryptomarkets, particularly since very little is known on cryptomarkets at a national level beyond a handful of studies providing fragmented results. This analysis is crucial at a time when the sale of recreational cannabis has been legalized in Canada with the objective of eliminating the black market for recreational cannabis. An examination of trends in cryptomarket sales as cannabis has become legal is an essential step towards understanding the impact of the legalization of recreational cannabis in Canada. To reach the main objective, this project drew from two data sources: the DATACRYPTO software tool and a cryptomarket drug dealer survey. We find that, following the legalization of cannabis, sales of cannabis on cryptomarkets by Canadian dealers appear to show an upward trend. The noted increase is mainly related to sales targeting an international market. When comparing July 2018 to November 2018 sales, Canada moves from 8th to 4th position in terms of cannabis sales on cryptomarkets. It should be noted that the analyses presented in this report are exploratory as the follow-up period post-legalization was extremely short and the data are sparse. These results could change in the long-term, when the legal supply of recreational cannabis is more firmly established, and the legal market has matured.
Author’s Note
The views expressed are those of the authors and do not necessarily reflect those of Public Safety Canada. Correspondence concerning this report should be addressed to:
Research Division
Public Safety Canada
340 Laurier Avenue West
Ottawa, Ontario
K1A 0P8
Email: PS.CSCCBResearch-RechercheSSCRC.SP@canada.ca
Introduction
The internet has become a distribution channel for the illicit sale of drugs. The first to take advantage of this distribution channel were online pharmacies that illegally sold prescription drugs (Bloom & Iannacone, 1999; Rost, 2000). Since 2011, a variety of sophisticated criminal entrepreneurs innovated beyond what traditional online pharmacies had done and created anonymous online marketplaces. Referred to as cryptomarkets (Martin, 2014), these platforms facilitate transactions of illegal goods and services among many sellers and buyers. Cryptomarkets are imperfect markets encompassing fluid networks of individuals who negotiate illicit drug use and illicit drug supply (Masson & Bancroft, 2018). To this day, such markets are used primarily to facilitate the sale of illicit drugs but are also used to sell other goods and services such as stolen financial information and counterfeit products (Christin, 2013). All participants register accounts and create profiles. Suppliers create listings to advertise the goods and services they wish to sell. Cryptomarkets are owned and managed by administrators who are responsible for publishing and enforcing the rules that all marketplace participants must abide by, as well as managing conflicts between participants (Morselli et al., 2017). The main objective of this report is to understand the illicit cannabis trade by Canadians on cryptomarkets. Our first motivation is to contribute beyond the handful of existing studies that provide fragmented results on this phenomenon by scoping cryptomarkets at a national level. This sort of analysis is crucial at a time when the sale of recreational cannabis has been legalized in Canada. One of the main objectives of legalization is to eliminate the black market for illicit drugs. An examination of Canadian trends in cryptomarket sales as cannabis enters its legalization era is an essential step in that process. The timing of the project prevents us from providing a systematic evaluation of the impact of legalization on cryptomarkets. Yet, an assessment of late 2018 trends will provide a foundation for a structured discussion of the implications of legalization on cryptomarkets for cannabis in Canada. Before we conduct any analyses, we first provide a background on cryptomarket research, including past research that focused specifically on cannabis sales.
The Rise of Cryptomarkets
Innovation in cryptomarkets extends from a combination of three technologies that vastly increase the security of participants (Kruithof et al., 2016). First, cryptomarkets use the Tor network to hide their participants’ IP addresses by routing their internet traffic through a series of anonymous proxies. The same network is also used to obfuscate cryptomarkets’ servers’ locations, thus making the identification of cryptomarket staff and participants and the dismantling of websites more difficult. Second, all payments on cryptomarkets must be made in cryptocurrencies. These cryptocurrencies are pseudo-anonymous virtual currencies, such as bitcoin, that can easily be used to launder money and make financial tracking within the traditional financial system difficult. Finally, cryptomarkets strongly encourage their participants to encrypt their communications. This technology ensures that only parties involved in a conversation can decrypt the messages, thus limiting information leakage if law enforcement manages to seize a cryptomarket server.
The first cryptomarket, Silk Road (SR1), was launched in February 2011 and remained active for over two and a half years, before being shut down in October 2013 by U.S. law enforcement agencies (Department of Justice, 2015). The arrest of the principal administrator and his subsequent trial provided insights into the wealth that cryptomarket administrators can amass through the commissions they charge on each transaction they facilitate. In the case of SR1, it is believed that these commissions added up to over US$ 80,000,000 (Kovach, 2013). This can explain why, following SR1’s demise, a number of cryptomarkets were launched. Most of these did not survive for more than a few months due to either police disruption or exit scams (Branwen, 2018). Exit scams are cryptomarket shut downs following the theft of all the deposits of their participants by cryptomarket administrators. Cryptomarkets offer an escrow service where buyers can put their payments in the cryptomarket administrators’ control while they wait for their purchase to be delivered by traditional mail services. Payments under escrow can add up to more than US$ 100,000,000 (Bradbury, 2013) in some cases, providing a strong incentive to exit scam.
The list of active cryptomarkets is constantly updating with new markets emerging and shutting down on an almost biweekly basis. For example, the Cannabis Growers and Merchant Cooperative, a well-established cryptomarket, shut down mere days before the time of writing this report. Sales on cryptomarkets have increased significantly over the years, expanding from US$ 14,400,000 in 2012 (Christin, 2013), to almost US$ 90,000,000 in 2014 (Aldridge & Décary-Hétu, 2014), and hundreds of millions of US dollars in 2016 (Kruithof et al., 2016). Estimates of the volume of sales on cryptomarkets are based on the automated feedback systems on cryptomarkets. Customers are strongly encouraged to leave feedback each time they make a purchase just like users of commercial platforms like Amazon. Feedbacks are therefore considered traces of past transactions and indicate how many sales each item has generated. To calculate each item’s revenues, the number of feedbacks is multiplied by the price of the item for a given period. This provides an estimate of the volume of sales as not all buyers leave feedback after a purchase. Unfortunately for future research, sales estimates based on feedbacks appear to be less and less reliable. On SR1, about 88% of transactions generated a public feedback (Aldridge & Décary-Hétu, 2014). In 2016, that estimate dropped to about 70% (Kruithof et al., 2016) and informal discussions with law enforcement agents suggest that such estimates may now stand closer to 55%.
Cryptomarkets are mostly used to purchase drugs (Christin, 2013; Kruithof et al., 2016). Cannabis represents about a third of all cryptomarket drug ads – also known as listings – , with prescription (24%) and ecstasy types (17%) in second and third place. Cannabis also generates the most sales with 33% of all drug sales on cryptomarkets (Kruithof et al., 2016). Stimulants (with 24%) and ecstasy (with 16%) are the second and third highest grossing revenue types of listings. Prescription listings come close with 15% of all drug revenues. Although the size of cryptomarkets is still marginal compared to international illicit drug markets, more than 50% of drug users from Australia and the United States, and 40% from the United Kingdom reported that they were aware of cryptomarket existence in a 2012 online survey (Barratt et al., 2014). Among those that answered positively to that question, 7% of Australians, 18% of Americans, and 10% of UK respondents reported having consumed drugs purchased through cryptomarkets at least once.
In interviews, cryptomarket buyers reported their satisfaction of the variety of drugs available on these platforms, their higher quality and the vendor rating systems (Barratt et al., 2014). They also reported that the transaction process was more convenient, professional, and safer than traditional drug purchases (Van Hout & Bingham, 2013a, b; Barratt et al., 2014). To assess whether users’ perception of higher quality drugs is accurate, Caudevilla et al. (2016) chemically analyzed samples of cocaine, LSD, MDMA, amphetamine, ketamine, and cannabis bought on cryptomarkets and found that most substances contained the advertised ingredients and most samples tested were of high purity. This finding suggests that cryptomarkets may reduce harm linked to drug use (Aldridge et al., 2018; Barratt et al., 2016). Indeed, drug users who buy on cryptomarkets may have a better idea of what drugs they are using and how to safely use them, reducing potential health issues. Moreover, drug buyers and dealers never get the chance to meet in person and are often located in geographically distinct locations. As such, the odds of violence between participants are close to null. These factors suggest that cryptomarkets may reduce harms traditionally associated with drug use and drug markets (Aldridge et al., 2018; Barratt et al., 2016). Although lack of direct evidence makes these harm reduction assumptions unclear (Mounteney et al., 2018; van der Gouwe et al., 2018), cryptomarkets are believed to provide safe settings where participants can share information about drug use and discuss their drug consumption experiences without conventional stigmas (Maddox et al., 2016; van Hout & Bingham, 2013a; 2013b; 2014).
Drug dealers – also known as vendors – have also shown appreciation for cryptomarkets. They report enjoying the simplicity in setting up a vendor account, the possibility to operate in a low-risk environment, and the open access to a large pool of potential customers (Barratt et al., 2014; van Hout & Bingham, 2014). Some drug dealers leverage cryptomarket forums as an advertisement platform to increase their reach to new potential buyers, an opportunity that is not available for traditional drug dealers (Paquet-Clouston, 2017; Paquet-Clouston et al., 2018a). Yet, vendors also face multiple constraints when selling online. Paquet-Clouston et al. (2018b) found that the size and scope of vendors’ activities are limited due to: 1) anonymity; 2) illegality; and 3) online features of cryptomarket drug transactions. The illegal status of drugs forces vendors’ offline activities to stay within a small size and scope. The online feature fosters competition, while the anonymity feature influences buyers to concentrate their purchase to highly reputable sellers who are known to the community. Cryptomarkets are thus top-heavy competitive settings where only 1% of drug dealers make regular sales and where 90% of drug dealers are limited to peripheral roles (Paquet-Clouston et al., 2018b). New vendors face high barriers to sales, having to prove their trustworthiness to other participants. A high concentration is also found in buyers’ purchase distribution: only 10% of buyers’ accounts represent more than half of all drug transactions (Norbutas, 2018); many buyers never make a second purchase on cryptomarkets. Considering that only a small fraction of both vendors and buyers contribute to most of the recurrent activities on the platform, this has implications for assessing the size and scope of cryptomarkets.
The Cannabis Trade and Cryptomarkets
Cannabis plays an important role in cryptomarkets in that it is the most trafficked drug on these platforms (Christin, 2013; Kruithof et al., 2016; Soska & Christin, 2015). Cannabis-related products represent roughly 25% of all sales on cryptomarkets and have the most listings of all substances (Demant et al., 2018a; Soska and Christin, 2015; van Burskirk et al., 2016).
In the traditional market, cannabis has many distinctive features. Whereas the production of cocaine or heroin is largely concentrated in specific areas where the climate is conducive to the growth of their plants (Boivin, 2010), cannabis production is more evenly developed and distributed across the globe, with Western countries supplying a large amount of their own domestic demand for the drug (Bouchard et al., 2011). Domestic production of cannabis in developed countries is found to emanate from the convergence of technological innovations, such as hydroponic greenhouses, a certain tolerance for its use, and less active or effective law enforcement action against its consumption (Bouchard, 2008; Bouchard et al., 2011). A large proportion of traditional cannabis supply occurs through social supply (Hathaway et al., 2018). Informal methods for acquiring the drug, such as buying from a friend or a close acquaintance, growing the drug at home, or receiving it as a gift, are common for cannabis drug users (Caulkins & Pacula, 2006; Caulkins, 2007; Decorte et al., 2011; Nguyen & Bouchard, 2013). Indeed, the National Household Survey on Drug Abuse in the U.S. found that 58% of consumers received cannabis for free and 87% bought it from a friend (Caulkins, 2007). The 2018 Canadian Cannabis Survey similarly reported that 24% of the respondents obtained free cannabis edibles and 14% obtained dried flower/leaf, while 34% obtained such drugs from a friend. The trend towards social supply illustrates that a more global and tolerant public opinion toward cannabis is forming. With little evidence of harm reduction from sustained and punitive prohibition (Hathaway & Erickson, 2003), laws in certain countries have become more flexible or even completely revised. Policy analysts are now trying to find a new global consensus to review the United Nations drug control conventions, as countries are slowly moving toward legal regulation on the consumption of non-medical cannabis (Jelsma et al., 2018). Uruguay and a growing number of American States have completely legalized the consumption, distribution, and production of cannabis. Canada adopted the Cannabis Act in 2018, legalizing cannabis related-activities with varying regulations across provinces/territories. Other countries, such as Australia and Argentina, have legalized the drug when produced or used for medical purposes.
Although cannabis production has been found to be distributed around the globe, a different picture is depicted on cryptomarkets: Western hemisphere countries dominate the supply for cannabis. Based on data from eight cryptomarkets, vendors shipping from the United States have been found to generate 50% of all cannabis sales and up to 32% of cannabis transactions (Décary-Hétu et al., 2018). Beyond the American context, total sales were attributed to vendors shipping from Germany (10%), the United Kingdom (9%), Canada (9%), Australia (7%) and the Netherlands (3%). Overall, the sales within these six developed countries represented 88% of total cannabis sales (Décary-Hétu et al., 2018). As cryptomarkets are found to be mainly localized, we can hypothesize that a strong proportion of cannabis cryptomarket buyers also reside within these countries (see below). Moreover, Demant et al. (2018b) suggest the presence of wholesale purchases rather than personal use and social supply purchases. This finding is supported by Décary-Hétu et al. (2018), who found that half of all revenues generated for cannabis on cryptomarkets were for transactions between 28 and 454 grams. At least in the U.S., the price per gram of cannabis appears to be higher on cryptomarkets than on the streets (Décary-Hétu et al., 2018).
Geographic Positioning of Cryptomarket Participants
At first, cryptomarkets were expected to be a game changer for the global drug trade (Martin, 2014) in that they allowed vendors to reach new international markets. However, studies have found the opposite trend. In most cases, cryptomarket transactions are taking place at the regional/national level (Décary-Hétu et al., 2016; Demant et al., 2018a; Norbutas, 2018). This means that buyers are more likely to make purchases from vendors located in their own country or at least in the same region (e.g., Scandinavia for Denmark). According to Norbutas (2018), this geographic clustering is stronger between continents and weaker for countries within Europe where borders are open. Buyers who do purchase from multiple countries are more likely to select vendors operating from the same continent. A willingness to order from different countries may be higher for customers in the cluster of countries that have open borders with free transit of goods and people. In such settings, package inspections may be less frequent than when packages are coming from countries like Colombia, which is known for its cocaine production. Indeed, participants’ relative avoidance of international trading may be explained by the risks involved with shipping drugs internationally: the shipped package has a higher chance of being intercepted (Décary-Hétu et al., 2016; Norbutas, 2018; Volery, 2017). Package interceptions cause delays and create conflicts among cryptomarket participants. Buyers who have not received their drugs quickly protest on forums by calling their vendor a “scammer”. Such name calling can diminish the community’s trust in the vendor, undermining the account’s reputation (Morselli et al., 2017). Buyers can also decide to buy only from local vendors and thus avoid potential border interceptions (Demant et al., 2018a; Norbutas, 2018).
Participants’ decisions to trade at the international or more local levels also depend on where they are in the world. For example, vendors located in countries where there is a high demand for drugs tend to sell at the local level (Décary-Hétu et al., 2016). On the other hand, vendors in countries with a small drug consumption population, low gross domestic product (GDP) per capita, or low perceived effectiveness in law enforcement are more inclined to offer international shipping (Décary-Hétu et al., 2016). Van Burskirk et al. (2016) found evidence of country-specific differences in substance availability based on the origin of sellers. Australian vendors tend to avoid shipping abroad due to the country’s geographic isolation and high drug prices. Chinese vendors, on the other hand, due to their proximity to the Golden Triangle and China’s strict control of new psychoactive substances (NPS), are more likely to ship drugs, such as NPS, abroad. Perhaps due to flexible drug laws and the accessibility to illicit drugs, Dutch vendors were more likely to ship at the international level. Van Burskirk et al. (2016) also found that American cryptomarket dealers dominated the sale of cannabis. They hypothesized that such dominance could be explained by the legalization of the substance in some American states, which would give vendors from these states a comparative advantage over others. According to these authors, some vendors even advertised that they were established in the states where cannabis was legal. The regional nature of cryptomarkets also has implications on the pricing of illicit drugs (Cunliffe et al., 2017). For example, illicit drugs are known to be more expensive in the streets of Australia than in Canada. The same is true of cryptomarkets. Two studies have focused on the activities of Canadians on cryptomarkets (Broséus et al., 2016; Mireault et al., 2016). They both found that cannabis is the most trafficked drug by Canadian dealers (followed by ecstasy and psychedelic drugs) and that a majority of Canadian vendors are willing to ship anywhere in the world.
The Implications of Cannabis Legalization
Following the adoption of the Cannabis Act in Canada, policy makers and scholars have shown an interest in assessing how the new legal framework influences the activities of Canadian cryptomarket participants. There are two questions that have yet to be answered: 1) will Canadian cannabis cryptomarket vendors increase their activity, considering that they can easily access the drug?; and 2) will Canadian buyers stop purchasing on cryptomarkets because cannabis is easily accessible legally? Extant research on cannabis decriminalization and legalization focuses on the effect of new regulatory frameworks on cannabis demand and supply, both licit and illicit, as well as on the implications of these frameworks for public health (for a review, see Kilmer, 2014). Most authors conclude that the net effect of cannabis legalization depends on how the market is regulated. For example, in a prohibition context, the risk of arrest and the structural consequences of product illegality lead to cost inflation for producing, distributing, and wholesaling cannabis, a cost that is reflected in consumer prices (Caulkins, 2010; Reuter, 1983; Reuter and Kleiman, 1986). Legalization, on the other hand, leads to economies of scale, which in turn reduces production costs and the retail price (Caulkins et al., 2012). In this context, the price could be reduced by up to 80%. This drop depends on whether production can be vertically integrated entirely by authorized producers (Kilmer et al., 2010). However, a lower retail price is not necessarily of interest as it can lead to an increase in cannabis consumption. Indeed, users are sensitive to changes in the price of cannabis (Gallet, 2010; Ouellet et al., 2017). In the United States, Pacula (2010) found that a 10% decrease in price leads to, on average, a 3% increase in cannabis consumption. In Canada, the best estimates that are available report similar proportions. Ouellet et al. (2017) estimated that the price elasticity of demand for Canadians was between ‑0.42 and -0.60, meaning that a 10% drop in price could lead to a 4 to 6% increase in the total amount of cannabis consumed.
The price of legal cannabis thus needs to be appropriately set. According to Ogrodnik et al. (2010), the legal price should be marginally higher than the price found in an illegitimate scenario. Price adjustments would account for the risks in dealing within illicit markets, while compensating for the potential increase in demand. However, if the legal price of cannabis is set too high, many cannabis users may turn to the black market to supply their drugs (Caulkins et al., 2012; Kilmer et al., 2010; Ouellet et al., 2017). Legalizing cannabis could increase accessibility to the drug and physical spaces to consume it, which could also lead to an increase in consumption (MacCoun & Reuter, 2011). Recreational use is expected to increase, but the magnitude of the change to come is unknown (Hall and Linskey, 2016; Kilmer et al.; 2010; Ouellet et al., 2017).
In CanadaFootnote1, provinces and territories hold the responsibility of deciding how legal cannabis is distributed and sold in their jurisdictions. Online stores are available in each province and territory, allowing customers to have cannabis shipped to their residence. All provinces and territories, except Quebec and Manitoba, allow growing home plants for personal consumption. Prior to legalization, Mahamad and Hammond (2019) investigated the number of illicit retailers and the price they offered across the largest municipality of each province and territory in Canada. They found a total of 997 cannabis retailers and 215 physical storefronts. They state that the average price of cannabis ranges between $7.80 and $12.30 per gram depending on the cannabis strain, which converged with Ouellet et al.’s (2017) analyses.
The effect of cannabis legalization on the activity of cryptomarket participants has yet to be investigated. One could expect that Canadian cannabis buyers will have little incentives to buy on cryptomarkets, as the drug is easily accessible across the country. Moreover, Décary-Hétu et al. (2018) suggests that Canada could increase its share of the cryptomarket cannabis market over subsequent years. Indeed, some U.S. cryptomarket cannabis dealers do advertise their location in States where cannabis has been legalized, while also using the quality controls of their State over cannabis production as a marketing tool. Canadian cryptomarket cannabis dealers may follow along and take advantage of the high-quality legal production to supply the black market in Canada or abroad.
Moving Forward
Since the creation of Silk Road 1, cryptomarkets have garnered a lot of attention from the media and the academic world. Such innovative markets have been the focus of books (Martin, 2014; Ormsby, 2014), special issues from a leading drug policy journal (International Journal of Drug Policy vol. 35 in 2016, and forthcoming in 2019), and a rapidly expanding repertoire of peer-reviewed articles. The field is well established and combines the efforts of interdisciplinary researchers that have introduced new methods to current work. Two types of research designs have dominated cryptomarket research. The first combines the efforts of a small number of qualitative fieldwork efforts with cryptomarket participants. Such work has generated insights into the experiences and perceptions of cryptomarket actors. The second set of studies focuses on more extensive cross-sectional data from public cryptomarket sources (e.g., listing descriptions, vendor profiles, feedbacks). Such research has generated insights into the type of drugs being sold, the shipping routes of drugs, as well as the revenues that each type of drug generates. As the research reviewed has demonstrated, these studies have rapidly responded to the growing trend that the drug cryptomarket phenomenon represents, while also remaining sensitive to the implications and knowledge transfer exercises that are needed to guide governmental agencies and other concerned groups that are involved in current and rapidly changing drug policies in Canada and across the world.
If there is one caveat worth mentioning, it is that most studies examine cryptomarkets as a global phenomenon without taking the time to focus on either a specific type of drug or a specific country. Only two recent studies have focused on the national/local level (see, for example, Broséus et al., 2016 for a study on Canadian actors on cryptomarkets and Duxbury and Hainie, 2017 for the structure of opioid distribution). Traditional drug research has sought to understand drug markets by taking a more targeted approach toward a specific drug or in a specific region or country. Such targeted approaches are necessary because researchers can better appreciate, and control for, how specific regulations and policies may impact the online drug trade. What prior studies have showed is that, regardless of the seemingly limitless reach of the cryptomarket phenomenon, participants’ decisions are nevertheless influenced by their local context and the specific types of drugs they deal. In this sense, online markets are very akin to traditional drug markets. By focusing on such national/local trends, policy makers can better assess trends in respective jurisdictions. Moreover, most research is based on cross-sectional data. Such studies provide insights into how cryptomarket actors behave at a specific point in time, but make it difficult to build trends over time. Modeling the evolution of cryptomarkets, while focusing on local/national contexts and specific drug types, will provide insights on how changes in local contexts modify cryptomarket participants’ operations.
With the adoption of the Cannabis Act in Canada, the local context in which Canadian cryptomarket vendors and buyers operate has inevitably changed. Previous studies indicate that, depending on how the legal market is regulated, the impact of legalization on illicit markets may not necessarily be damaging. Cannabis is known to be the most popular drug that is traded on cryptomarkets and Canada is one of the top suppliers. Canadian cannabis cryptomarkets thus become a critical object of study. By understanding the evolution of Canadian cannabis cryptomarkets over recent years, we can uncover how participants in Canadian cryptomarkets have been impacted by this new regulatory context, at least in the very short-term. Based on the study results, policy makers will have a better understanding of the phenomenon and will be better equipped to address the rise in cryptomarkets.
Approach and Project Objectives
Apart from Kruithof et al.’s (2016) extensive report on cryptomarket illicit drug dealing in the Netherlands, there is still very little that is known about cryptomarkets at the national level. The Kruithof et al. (2016) report was commissioned by the Dutch Ministry of Justice and Security to better understand the general patterns and processes surrounding cryptomarket illicit drug dealing in that country. Australia (Broséus et al., 2017; Cunliffe et al., 2017) and Canada (Broséus et al., 2016; Mireault et al., 2016) have also received some attention by researchers, but the results from these studies are still fragmented and require validation. The lack of national research on cryptomarkets can be explained by the initial belief that cryptomarkets were paradigm shifting innovations (Aldridge & Décary-Hétu, 2014; Martin, 2014). Cryptomarkets offered the promise of removing many of the traditional layers between illicit drug producers and illicit drug users to lower costs and streamline distribution channels. The shipment of illicit drugs through the postal system also enabled drug users to choose the best supplier of illicit drugs among an international pool of dealers and at the most affordable price.
Recent research findings suggest that the impact of cryptomarkets may be most apparent at a national level. Cryptomarket drug dealers tend to sell locally to reduce the risks of shipment interceptions (Décary-Hétu et al., 2016) and the sale of illicit drugs generally occurs at national or regional levels (Demant et al., 2018). Moreover, differences in the prices of illicit drugs across countries remain largely the same on cryptomarkets (Cunliffe et al., 2017). Cryptomarket participants therefore appear to operate at the national level and this conceptualization of cryptomarkets opens new avenues for research that focuses on a single country at a time. The legalization of cannabis in Canada represents an interesting opportunity to launch this new research agenda as Canada is responsible for a significant share of cannabis transactions (Décary-Hétu et al., 2018). The scale of Canadian cannabis trafficking through cryptomarkets will allow for a quantitative analysis of the trends of supply for cannabis at the national level. Moreover, Canada legalized cannabis in October 2018 and this new regulatory project will provide a preliminary understanding of how such a legislative change has impacted the activities of Canadian drug dealers and drug users on cryptomarkets.
The work plan for this project allows for the analysis of data that were collected until November 2018. Although the full impact of legalization cannot be measured in this timeframe, it should be enough to explore and contemplate the changes to come that could be analyzed in a future project. The general aim of this project is to understand the illicit cannabis trade by Canadians on cryptomarkets. More specifically, this project aims to understand the recent trends in the supply side of the illicit cannabis trade by Canadians on cryptomarkets. In doing so, we aim to further our understanding of how cryptomarkets operate, especially as it relates to the relative embeddedness of cannabis vendors into cryptomarkets, relative to other drugs.
Data Sources
To reach these aims, this project will draw from two main data sources: the DATACRYPTO software tool and a survey of cryptomarket dealers.
DATACRYPTO
The data for this project was first collected using the DATACRYPTO software tool (Décary-Hétu, 2015). This tool has been in operation since 2013 and has been used as a source of data for over 10 academic papers and government reports, including Kruithof et al. (2016) and Martin et al. (2018). Demant et al. (2018a, 262) provided a thorough analysis of the quality of the data collected by DATACRYPTO between 2013 and 2016 and found “no grounds for concerns” with the data.
The technology that powers DATACRYPTO evolved throughout the years, but its inner workings always remained the same: DATACRYPTO is a web crawling and scraping software. Basically, the tool connects to a website and automatically downloads the website’s content. The tool subsequently extracts specific information from the downloaded content, such as the price of a listing or the description of a seller. This information is then stored in a database management system. To date, the DATACRYPTO software tool has collected data from over 40 cryptomarkets. It has information about hundreds of thousands of cryptomarket vendors, millions of cryptomarket listings, and tens of millions of customer feedbacks. Appendix A provides a list of the information collected on each listing, vendor, and feedback.
For this report, we used two data collection events that occurred in July 2018 and November 2018. These events represent the general state of cryptomarkets before and after the legalization of cannabis in Canada. The first event collected 162,643 listings from 4,469 vendors on eight cryptomarkets: Apollon, Berlusconi, CGMC, Dream Market, French Deep Web, Flugsvamp, Tochka and Wall Street. The second event collected 180,917 listings from 4,057 vendors on six cryptomarkets: Apollon, Berlusconi, CGMC, Dream Market, French Deep Web and Tochka. The major Wall Street Market platform could not be included in the November data collection because its anti-bot technique was updated in the fall of 2018 and prevented DATACRYPTO from collecting a full copy of the listings and vendor pages. The minor cryptomarket Flugsvamp is also not included in the post-legalization dataset because the market was shut down prior to November 2018.
Manipulations were made to clean and validate these two datasets. First, listings were categorized based on a machine learning algorithm similar to Soska and Christin’s (2015) algorithm. The machine learning algorithm was trained on a set of 650,000 listings that were manually labelled by research assistants between 2016 and 2018 with an intercoder reliability of over 98%. Second, cryptomarket vendors can indicate where they are willing to send and receive their products (e.g., SHIP FROM Canada; SHIP TO Canada, USA). The names of the countries of origin and destination for all listings were manually analyzed, cleaned, and standardized across all cryptomarkets in the dataset. Third, cryptomarket vendors have been known to increase the price of their listings by one or more orders of magnitude (holding prices, see Soska & Christin, 2015) to make their listing so prohibitively expensive that no customer will place an order. This technique is used to keep the listings active while the vendor sources more products or is on vacation. Following Soska and Christin’s (2015) methodology, all the listings priced at $3,000 were manually reviewed to identify and remove listings with inappropriately high prices. This cleaning process was repeated for the cannabis listings using the price per gram metric generated only for those listings. Any listing with a price per gram higher than $30 was manually inspected and removed if found to have a holding price. Finally, research assistants helped to manually code the volume of products sold for each cannabis listing. Even when the weight of cannabis sold was indicated in the data, the information was manually coded to ensure maximal accuracy. This provided further cleaning of the cannabis dataset as it allowed for the removal of some of the listings that were wrongly classified by the machine algorithm. Cannabis listings with no indication of the weight were removed from analyses.
Tables 1a and 1b present the descriptive statistics for both data collection events. The main source of data comes from Dream Market, which accounts for 78% of all listings and 96% of all revenues on cryptomarkets in July 2018 and for 84% of all listings and 92% of all revenues in November 2018. This is unsurprising: the cryptomarket economy is known to be highly concentrated and controlled by a relatively small number of vendors who make most of the drug sales (Paquet-Clouston et al., 2018). However, these revenue percentages are slightly inflated since feedbacks on French Deep Web (FDW) could not be associated with a price and feedbacks on Flugsvamp could not be associated with a specific product. Indeed, FDW only associated feedbacks with vendors and not listings, making it impossible to link feedbacks to specific listings and therefore drug types and prices. Due to these limitations, feedbacks from these two cryptomarkets could not be included in our analyses.
Conservative and Optimistic Approaches
Past studies (see Aldridge & Décary-Hétu, 2014; Kruithof et al., 2016) have found that not all sales lead to a feedback that can be downloaded and analyzed. To compensate for the missing feedbacks, we decided to present sales and revenues that follow conservative and optimistic assumptions. The conservative approach is based on Aldridge & Décary-Hétu’s (2014) study and assumes that the number of feedbacks should be at least multiplied by 1.14 as about 88% of transactions were identified through a feedback (100 / 0.88 = 114%). In the optimistic model, feedbacks are multiplied by a factor of 1.82 to compensate for the fact that as few as 55% of transactions can be identified through a feedback (100 / 0.55 = 182%). This number is based on our informal contacts with knowledgeable experts in law enforcement agencies that had access to seized cryptomarkets servers in the past year.
Weighing conservative and optimistic estimates when measuring the size of illicit markets is a common approach undertaken by other scholars (e.g. Bouchard et al., 2018). Of course, feedbacks are attractive metrics to measure sales as they provide a quantitative proxy that can be collected with ease. However, buyers may decide to leave no feedbacks and feedbacks can be forged. It is therefore always sounder to rely on more than one estimate in time of the number of feedbacks and, when possible, to rely on more qualitative analyses to better understand the accuracy of the collected feedbacks.
Cryptomarket |
Listings (N) |
Vendors (N) |
Yearly Sales (N) |
Yearly Revenues ($) |
||
|---|---|---|---|---|---|---|
Conservative |
Optimistic |
Conservative |
Optimistic |
|||
Apollon |
1,781 |
138 |
492 |
786 |
$33,345 |
$53,235 |
Berlusconi |
15,310 |
410 |
4,131 |
6,596 |
$1,379,974 |
$2,203,117 |
CGMC |
1,580 |
73 |
52,504 |
83,822 |
$3,784,834 |
$6,042,454 |
Dream Market |
127,190 |
2,010 |
1,917,361 |
3,061,051 |
$264,794,780 |
$422,742,544 |
French Deep Web |
3,619 |
512 |
0 |
0 |
$0 |
$0 |
Flugsvamp |
908 |
91 |
0 |
0 |
$0 |
$0 |
Tochka |
1,482 |
136 |
1,737 |
2,774 |
$96,252 |
$153,666 |
Wall Street |
10,773 |
1,099 |
126,485 |
201,933 |
$4,865,767 |
$7,768,154 |
Total |
162,643 |
4,469 |
2,102,710 |
3,356,962 |
$274,954,952 |
$438,963,170 |
| Cryptomarket | Listings (N) |
Vendors (N) |
Yearly Sales (N) |
Yearly Revenues ($) |
||
|---|---|---|---|---|---|---|
Conservative |
Optimistic |
Conservative |
Optimistic |
|||
Apollon |
230 |
41 |
41 |
66 |
$513 |
$819 |
Berlusconi |
18,881 |
456 |
39,522 |
63,096 |
$11,098,879 |
$17,719,263 |
CGMC |
2,103 |
77 |
9,261 |
14,786 |
$1,885,579 |
$3,010,310 |
Dream Market |
151,551 |
2,685 |
2,566,874 |
4,097,992 |
$332,912,292 |
$531,491,554 |
French Deep Web |
3,549 |
547 |
0 |
0 |
$0 |
$0 |
Tochka |
4,603 |
251 |
10,862 |
17,341 |
$17,783,316 |
$28,390,908 |
Total |
180,917 |
4,057 |
2,626,560 |
4,193,281 |
$363,680,579 |
$580,612,854 |
Taken together, Table 1a and 1b suggest that, between the two data collection events (July 2018 and November 2018), cryptomarkets had an 11% increase in the number of listings, a 25% increase in sales (based on feedbacks), and a 32% increase in revenues. The number of vendors dropped by 9%. Such changes should be considered once again in the context of the Wall Street market that could not be included in the second data collection.
Overall, in November 2018, the cryptomarket economy appears to have generated sales between US$ 364 million and US$ 581 million on a yearly basis, compared to between US$ 275 million and US$ 439 million in July 2018. These numbers need to be interpreted carefully. Many events (e.g., servers’ maintenance; vendors simultaneously taking a vacation; or rumors of a large police operation being launched in the near future influencing participants’ behaviours) can disrupt cryptomarket activities on a daily basis. The numbers presented in this report should therefore always be considered as estimates of cryptomarket activities.
Survey of Cryptomarket Drug Vendors
To better understand how cryptomarket vendors operate, we used a survey of cryptomarket drug dealers conducted by David Décary-Hétu and his research team between October 24 and December 1, 2017. This survey is the first to use first-hand fieldwork with cryptomarket vendors, a population that is difficult to access and that is usually unwilling to share information due to the illegal status of their activities. This research was approved by the Research Ethics Committee at the Faculty of Arts and Sciences, Université de Montréal (Project no. CERAS-2015-16-030-D).
The main aim of the survey was to assess the impact of a cryptomarket on episodes of drug-related conflicts and violence involving vendors. The survey includes questions about: 1) offline and online drug sales experiences; 2) drug-related conflicts; 3) drug dealers’ networks; and 4) drug dealers’ demographics. Private messages were sent to 1,092 drug dealers that were involved in 10 cryptomarkets (Aero; Berlusconi; Cannabis Growers Merchants & Cooperative; Dream Market; Libertas; RSClub Market; Sourcery Market; Tochka; Trade Route; and Zion). Overall, 745 visitors opened the link to the survey’s website hosted on the Tor network. Of these 745 visitors, 133 answered the survey questions at least partially and 20 completed the entire survey. Our analysis is based on these 20 respondents and a group of approximately 20 more who answered many questions of interest for this report. This is a small convenience sample of respondents; our results are modest and exploratory. The results can nonetheless help us gain an understanding of the type of vendors who are active on cryptomarkets, and their relative embeddedness in illegal markets.
Methods
To understand the trends in the supply side of the online illicit cannabis trade by Canadians on cryptomarkets, we used the data collected with the DATACRYPTO software tool. All analyses include results (in different tables) for both the July 2018 dataset (prior to cannabis legalization in Canada) and the November 2018 dataset (after cannabis legalization in Canada).
In the first series of analyses, we identified cannabis listings with a shipping from Canada or North America field (henceforth the Canadian cannabis listings) and generated descriptive statistics on a yearly basis on the number of listings, the number of dealers, the number of sales, revenues (USD), the volume of drugs (kg), and the price per gram (USD). The latter is based on the methodology by Décary-Hétu et al. (2018). Since there is an interest in the size and scope of the Canadian cannabis cryptomarket, the aggregated statistics are based on cannabis listings explicitly stating that the product is shipped from Canada. Canadian listings shipping to Canada (with a shipping from Canada or a region that includes Canada such as North America) were compared with Canadian listings shipping at the international level. The former represents listings that respond solely to the Canadian cannabis demand (domestic listings), whereas the latter represents Canadian cannabis supply responding to a domestic and an international demand (international listings).
In a second series of analyses, vendors were selected behind the Canadian cannabis listings and identified the most common products they sold on cryptomarkets (other than cannabis). For each product type, we estimated the number of listings, the number of sales, and generated revenues (USD). This provided us with an estimate of the importance of vendors’ cannabis sales compared to their overall cryptomarket activities.
In a third series of analyses, we identified the most common destinations of Canadian cannabis listings. For each route, we calculated the number of listings and the sales and revenues they generated (USD) as indications of where Canadian cannabis was being delivered. An important differentiator is whether a cannabis listing is made available to Canadians or to individuals outside of Canada. The former represents Canadian cannabis supply to other Canadians, whereas the latter shapes the Canadian supply to international customers, including Canadians.
In a fourth series of analyses, we identified the most common regions of the world where cannabis dealers operated outside of Canada. We estimated the number of cannabis dealers, the number of listings, the number of sales, the volume of cannabis sold (kg) and generated revenues (USD) from each region. This enabled us to better situate the role of Canadian dealers in the global cryptomarket cannabis economy.
Finally, using Paquet-Clouston et al.’s (2018b) methodology, we assessed the competition level in the Canadian and international cannabis markets. This informed us on the structure and vulnerability of the cryptomarket cannabis market. If a small number of drug dealers control a sizeable portion of the volume and transactions of cannabis, disruption operations may have a much better chance of succeeding.
To understand the trends in how cryptomarkets operate, we used the survey data to qualitatively discuss the potential origin of the products sold on cryptomarkets, the size and scope of cryptomarket vendors, their involvement in traditional drug dealing, and their relationship with organized crime. Survey responses reveal previously inaccessible information, but the limited response rate restricts what we can infer from the results. We urge readers not to use the results beyond these specific limitations. The countries of origin of the survey participants are also unknown and national differences may impact the results that apply specifically to Canadian dealers.
Our analysis begins by creating a typology with six classes of vendors. These are used to provide more personal details about the type of individuals dealing drugs on cryptomarkets. We then present the survey participants’ demographics and subsequently address specific questions that could help us understand how cryptomarket vendors operate. Such inquires include: 1) where they source their products; 2) the size and scope of their activities; 3) the extent to which they are involved in traditional drug dealing; and 4) the extent to which they (and their network) are involved in organized crime. Although a handful of scholars investigated whether the organizations of those involved in online criminality can be considered “organized crime” (Broadhurst et al., 2014; Leukfeldt et al., 2017; Lusthaus, 2013), little to no knowledge is available on the extent to which traditional organized crime is involved in online crime. Using the survey’s results, we assessed cryptomarket vendors’ potential involvement with traditional organized crime and provide first-hand knowledge on the structure of online/offline drug dealing.
Results
The first aim of this report is to understand the supply of Canadian cryptomarket cannabis. Below, we analyze the activities of Canadian cannabis dealers and situate these activities in the wider context of cryptomarket cannabis international trade. Most tables are presented in pairs – a) and b) – so as to capture the state of cryptomarkets before and after the legalization of cannabis in Canada.
Understanding the Supply Side of Cryptomarkets
As discussed above, cryptomarket dealers have the option of shipping their drugs domestically or internationally. Shipping drugs across national borders increases the odds of detection as most package inspections take place at a border (Décary-Hétu et al., 2016; Volery, 2016). Given that drug prices vary with risks (Reuter & Kleiman, 1986) and that shipping internationally is a risk-taking decision (Décary-Hétu et al., 2016), we should expect to find different metrics for listings that ship domestically, compared to those that ship internationally. Table 2a presents the sales, volumes and revenues of Canadian cannabis dealers before legalization.
Only Ship to Canada |
Ship Internationally |
Total |
|
|---|---|---|---|
Number of listings |
60 |
242 |
302 |
Number of dealers |
11 |
27 |
38 |
Number of sales |
|||
|
588 |
1,697 |
2,285 |
|
939 |
2,708 |
3,647 |
Volume (kg) |
|||
|
113 |
110 |
223 |
|
180 |
177 |
357 |
Revenues |
|||
|
$51,074 |
$432,162 |
$483,236 |
|
$81,539 |
$689,942 |
$771,481 |
Table 2a suggests that, before legalization, most of the listings (N = 242) offered international shipping and two thirds of the dealers (N = 27) were willing to ship internationally. Moreover, listings for international shipping generated almost three times as many sales and more than eight times as many revenues as domestic listings.
In terms of size and scope, the volume of cannabis sold per year of 357 kg for the optimistic model appears to be quite low. According to the Cannabis Tracking System, 7,313 kg of dried cannabis was sold in Canada during only January 2019 and 6,671 kg during February 2019, following legalization (Government of Canada, 2019). The revenues, in the hundreds of thousands of US dollars, are also marginal when compared to the CA$5.7 billion (US$4.2 billion) spent by Canadian consumers for medical and non-medical cannabis in 2017 (Statistics Canada, 2018). Thus, in July 2018, Canadian cryptomarket vendors did not seem to be major players in the cannabis business.
Table 2b presents similar statistics, but post-legalization. Table 2b suggests that the number of listings available in November 2018 (post-legalization) was higher than in July 2018. The number of Canadian cannabis vendors between the two periods is relatively stable. Cannabis sales, on the other hand, appear to have tripled, with an estimate of 11,576 yearly transactions for the optimistic model, compared to 3,647 transactions in July 2018. The volume of drugs shipped appears to have also increased as the November dataset optimistically estimates that 2,229 kg of cannabis are being shipped yearly, compared to 357 kg in the July dataset for the optimistic model. Indeed, for the post-legalization period, we estimate that about 2.5 tons of cannabis would now be sold and shipped annually from Canada. This vastly increases revenues, which aggregate up to US$ 6.9 million on a yearly basis in November 2018 for the optimistic model. We also observe an increase in the proportion of listings that ship internationally. The proportion of listings that ship internationally increased from 80% to 91% for all listings, reflecting a likely drop in domestic demand or a new opportunity to export cannabis that is now more widely produced and available. This is further supported by the drop in volume advertised by Canadian listings selling domestically between the two periods.
Only Ship to Canada |
Ship Internationally |
Total |
|
|---|---|---|---|
Number of listings |
50 |
491 |
541 |
Number of dealers |
8 |
38 |
46 |
Number of sales |
|||
|
643 |
6,607 |
7,250 |
|
1,026 |
10,550 |
11,576 |
Volume (kg) |
|||
|
86 |
1,310 |
1,396 |
|
137 |
2,092 |
2,229 |
Revenues |
|||
|
$63,178 |
$4,278,358 |
$4,341,536 |
|
$100,864 |
$6,830,360 |
$6,931,224 |
Table 3a presents the price per gram of Canadian cannabis listings before legalization, classifying the levels of cannabis sold based on categories developed by Décary-Hétu et al. (2018). It suggests that, in July 2018, most listings were advertising amounts of cannabis that ranged from 10 to 454 grams, with the most common listings selling between 28-454 grams. Such a finding supports the presence of wholesale purchases rather than personal use and social supply purchases (Demant et al., 2018b). Also, and as expected, the price per gram, whether considering the mean or median, is inversely proportional to the quantity of drugs purchased. The discount for purchasing large amounts of cannabis is substantial, especially when comparing both ends of the spectrum. The price per gram is higher for listings that ship internationally, once again reflecting the added risks of dealing drugs across borders (Décary-Hétu et al., 2016).
Amount |
Only Ship to Canada |
Ship Internationally |
Total |
N |
|||
|---|---|---|---|---|---|---|---|
Mean |
Median |
Mean |
Median |
Mean |
Median |
||
5 grams and under |
$6.84 |
$7.15 |
$15.17 |
$9.14 |
$12.67 |
$7.50 |
20 |
5 - 10 grams |
$6.33 |
$5.53 |
$19.57 |
$7.28 |
$16.69 |
$7.17 |
23 |
10 - 28 grams |
$3.91 |
$4.02 |
$7.09 |
$6.45 |
$6.32 |
$5.62 |
86 |
28 - 454 grams |
$3.19 |
$3.45 |
$4.82 |
$4.15 |
$4.58 |
$3.79 |
162 |
Over 454 grams |
$1.43 |
$1.39 |
$3.15 |
$3.90 |
$2.52 |
$1.58 |
11 |
Note. N refers to the number of listings.
Table 3b presents the price per gram of Canadian cannabis on cryptomarkets in November 2018. After legalization, most listings are once again selling in the 10 to 454 grams range. We observe the same relationship between the amount of cannabis purchased and the price per gram; the price per gram is inversely proportional to the quantity of drugs purchased. The median prices appear to have remained relatively stable before and after the legalization with price increases concentrated in the lowest weight range. A Mann-Whitney U analysis (not shown in tables) found no significant changes in the prices of cannabis before and after legalization, except for the lowest quintile (5 grams and under), where price per unit increased. These prices, both before and after legalization, are much lower than what was found in Décary-Hétu et al. (2018) for cannabis prices in the United States. Depending on the quantity and type of shipment, the difference between the two studies is around 20% cheaper prices in Canada in 2018, compared to the 2016 U.S. prices.
Amount |
Only Ship to Canada |
Ship Internationally |
Total |
N |
|||
|---|---|---|---|---|---|---|---|
Mean |
Median |
Mean |
Median |
Mean |
Median |
||
5 grams and under |
$6.22 |
$6.51 |
$20.82 |
$12.48 |
$19.73 |
$11.86 |
40 |
5 - 10 grams |
$4.78 |
$4.80 |
$8.56 |
$7.43 |
$8.19 |
$7.43 |
41 |
10 - 28 grams |
$5.59 |
$3.90 |
$8.49 |
$6.04 |
$8.15 |
$5.94 |
170 |
28 - 454 grams |
$3.60 |
$3.71 |
$4.81 |
$4.06 |
$4.70 |
$3.79 |
265 |
Over 454 grams |
- |
- |
$2.66 |
$2.59 |
$2.66 |
$2.59 |
25 |
Note. N refers to the number of listings.
Table 4a presents the other products that Canadian cannabis dealers sold, rank-ordered by the revenues they generated (highest to lowest) for the July 2018 data. Based on the revenues and sales presented in Table 1a, for the optimistic model, it appears that cannabis dealers who were active before legalization generated about US$ 1.6 million in revenue through their sale of illicit products other than cannabis. Their main other businesses involve stimulants (like cocaine), heroin, and tryptamines, though they provide a wide array of other drugs.
Sales (N) |
Revenues ($) |
Listings (N) |
|||
|---|---|---|---|---|---|
Con. |
Opt. |
Con. |
Opt. |
||
Stimulants |
2,353 |
3,756 |
$336,379 |
$537,027 |
110 |
Heroin |
1,477 |
2,359 |
$198,561 |
$317,000 |
100 |
Tryptamines |
1,053 |
1,682 |
$110,847 |
$176,966 |
33 |
Benzodiazepine/Sedative/ Hypnotics/Barbiturates |
684 |
1,092 |
$92,107 |
$147,048 |
54 |
Cannabis extractsa |
657 |
1,048 |
$71,439 |
$114,052 |
91 |
Herbal stimulants |
41 |
66 |
$52,503 |
$83,820 |
12 |
MDMA |
274 |
437 |
$40,903 |
$65,301 |
50 |
Dissociatives |
1,135 |
1,813 |
$26,152 |
$41,751 |
11 |
Opioids |
192 |
306 |
$21,042 |
$33,594 |
23 |
Financial information |
725 |
1,158 |
$16,407 |
$26,193 |
27 |
Other |
917 |
1,463 |
$33,834 |
$54,016 |
77 |
Total |
9,508 |
15,180 |
$1,000,174 |
$1,596,768 |
588 |
Note. Con. refers to the conservative estimates; Opt. refers to the optimistic estimates.
a Cannabis extracts and other types of cannabis were not included in the other analyses so as to maintain a consistent substance and volume that could be assessed across comparable listings.
Table 4b presents the other products that Canadian cannabis dealers sold, rank-ordered by the revenues they generated (highest to lowest) for the November 2018 data. A few weeks after legalization, Canadian cannabis dealers seem to have faced a reduction in their number of sales and revenues from other products. This could be explained by the sharp increase in cannabis sales. The top three drugs are now cannabis extracts (up from #5), MDMA (up from #7), and stimulants (down from #1), and they make up over half of all sales outside of cannabis. Stimulants are significantly down compared to pre-legalization sales. We notice a stronger presence of cannabis-related sales, with more sales of cannabis extracts as well as herbal stimulants and edibles and drinkables. We also see the rise of blades and other non-firearms weapons. The literature has seldom studied the sale of weapons from Canadian vendors in the past and this new trend should be monitored in the future. Another interesting trend is the diminishing sales for opioids, which should also be further studied. In total, sales of other products decreased by about 50% between July and November 2018.
|
|
Sales (N) |
Revenues ($) |
Listings (N) |
||
|---|---|---|---|---|---|
Con. |
Opt. |
Con. |
Opt. |
||
Cannabis extractsa |
192 |
306 |
$123,222 |
$196,723 |
40 |
MDMA |
397 |
633 |
$114,303 |
$182,483 |
25 |
Stimulants |
451 |
721 |
$56,977 |
$90,964 |
32 |
Benzodiazepine/Sedative/ Hypnotics/Barbiturates |
315 |
502 |
$53,686 |
$85,710 |
54 |
Heroin |
903 |
1,441 |
$51,079 |
$81,546 |
98 |
Tryptamines |
328 |
524 |
$27,636 |
$44,121 |
4 |
Herbal stimulants |
766 |
1,223 |
$19,104 |
$30,499 |
11 |
Prescription stimulants |
96 |
153 |
$17,754 |
$28,343 |
6 |
Edibles and drinkables |
547 |
874 |
$11,382 |
$18,171 |
1 |
Blades and other weapons |
328 |
524 |
$10,244 |
$16,354 |
4 |
Other |
1,026 |
1,638 |
$22,261 |
$35,539 |
64 |
Total |
5,349 |
8,539 |
$507,648 |
$810,453 |
339 |
Note. Con. refers to the conservative estimates; Opt. refers to the optimistic estimates.
a Cannabis extracts and other types of cannabis were not included in the other analyses so as to maintain a consistent substance and volume that could be assessed across comparable listings.
Table 5a presents the regions of the world where Canadian cannabis listings advertised shipping in July 2018. As shown, Canadian cannabis dealers offer more listings for shipping internationally, which generated around 89% of the market’s revenue. Note that some international sales could potentially include purchases from Canadian buyers. Based on the estimates above, the volume of cannabis shipped to Canada alone is slightly larger than the volume of cannabis offered internationally even though the revenues are much lower. This illustrates that sales between Canadian buyers and sellers may be less expensive and represent larger quantities. These sales, although less risky as they are domestic, seem much less profitable than international sales for Canadian vendors.
Destination |
Sales (N) |
Revenues ($) |
Volume (kg) |
Listings (N) |
|||
|---|---|---|---|---|---|---|---|
Con. |
Opt. |
Con. |
Opt. |
Con. |
Opt. |
||
Worldwide |
1,259 |
2,009 |
$349,139 |
$557,397 |
84 |
135 |
229 |
USA |
424 |
677 |
$82,660 |
$131,965 |
26 |
41 |
5 |
Canada |
588 |
939 |
$51,074 |
$81,539 |
113 |
180 |
60 |
Canada, North America |
14 |
22 |
$363 |
$580 |
0 |
1 |
8 |
Total |
2,285 |
3,647 |
$483,236 |
$771,481 |
223 |
357 |
302 |
Note. Con. refers to the conservative estimates; Opt. refers to the optimistic estimates.
Table 5b displays shipping routes using the post-legalization data. As shown, exports of cannabis abroad play an even more important role for Canadian cannabis dealers in the time period examined after legalization. Indeed, almost all their sales and revenues are generated from listings that target either the American or international markets. It is important to note again that sales of listings that can ship worldwide may very well have gone to Canadians. The domestic market appears to have slightly increased since July 2018, but that increase is much smaller than the increase in revenues for listings that were shipped to the United States and worldwide.
Destination |
Sales (N) |
Revenues ($) |
Volume (kg) |
Listings (N) |
||||
|---|---|---|---|---|---|---|---|---|
Con. |
Opt. |
Con. |
Opt. |
Con. |
Opt. |
|||
USA |
3,283 |
5,242 |
$2,139,087 |
$3,415,034 |
879 |
1,403 |
51 |
|
Worldwide |
3,201 |
5,111 |
$2,086,641 |
$3,331,304 |
429 |
685 |
366 |
|
Canada |
657 |
1,048 |
$105,640 |
$168,653 |
86 |
137 |
60 |
|
Canada, USA |
109 |
175 |
$10,168 |
$16,233 |
2 |
4 |
56 |
|
Asia, Canada, EU, USA |
0 |
0 |
$0 |
$0 |
0 |
0 |
7 |
|
Canada, UK |
0 |
0 |
$0 |
$0 |
0 |
0 |
1 |
|
Total |
7,250 |
11,576 |
$4,341,536 |
$6,931,224 |
1,396 |
2,229 |
541 |
|
Note. Con. refers to the conservative estimates; Opt. refers to the optimistic estimates.
Table 6a presents the top countries involved in the cryptomarket cannabis market based on the pre-legalization data extracted in July 2018.
Revenues ($) |
Sales (N) |
Volume (kg) |
Listings (N) |
Vendors (N) |
||||
|---|---|---|---|---|---|---|---|---|
Con. |
Opt. |
Con. |
Opt. |
Con. |
Opt. |
|||
USA |
$22,633,341 |
$36,133,930 |
78,929 |
126,010 |
9,067 |
14,475 |
3,657 |
316 |
UK |
$10,753,853 |
$17,168,431 |
100,071 |
159,763 |
4,498 |
7,182 |
3,472 |
181 |
Germany |
$8,495,746 |
$13,563,383 |
77,462 |
123,667 |
2,509 |
4,006 |
1,781 |
107 |
Australia |
$3,270,452 |
$5,221,248 |
19,959 |
31,865 |
549 |
877 |
293 |
39 |
North America |
$1,648,876 |
$2,632,416 |
15,623 |
24,941 |
1,558 |
2,487 |
466 |
1 |
EU |
$1,204,206 |
$1,922,504 |
13,425 |
21,432 |
393 |
627 |
728 |
74 |
France |
$994,380 |
$1,587,520 |
10,553 |
16,848 |
969 |
1,546 |
218 |
23 |
Canada |
$483,236 |
$771,481 |
2,285 |
3,647 |
223 |
357 |
302 |
38 |
Spain |
$415,826 |
$663,863 |
4,098 |
6,543 |
70 |
111 |
632 |
26 |
Other |
$1,676,627 |
$2,676,720 |
20,005 |
31,937 |
2,678 |
4,275 |
1,426 |
253 |
Total |
$51,576,543 |
$82,341,496 |
342,410 |
546,653 |
22,514 |
35,943 |
12,975 |
1,058 |
Note. Con. refers to the conservative estimates; Opt. refers to the optimistic estimates.
Based on Table 6a, prior to legalization, Canada ranked eighth for cannabis revenues, with optimistic yearly revenues of US$ 771,481. The USA, UK, and Germany occupied the first three positions, with yearly revenues above US$ 10 million for the optimistic model. Canada’s eighth position in the pre-legalization estimate of cannabis cryptomarket revenues may be explained in part by a law enforcement operation that targeted Canadian cannabis dealers. Gagné’s (forthcoming) study demonstrates that the sale of Canadian cannabis dropped tremendously in the weeks following a RCMP police operation in 2016, while sales from international vendors outside of Canada remained relatively stable. Table 6a also shows that, based on July 2018 data, the global cryptomarket for cannabis reached potential sales of over US$ 82 million, with 22 to 36 tons of cannabis sold per year.Such an amount is, however, still quite small considering that Canadians alone spent CA$ 5.7 billion (US$ 4.2 billion) for dry cannabis for medical and non-medical purposes in 2017 (Statistics Canada, 2018). Table 6b also presents the top countries involved in the cryptomarket cannabis market, but based on data extracted in November 2018, post-legalization.
Revenues ($) |
Sales (N) |
Volume (kg) |
Listings (N) |
Vendors (N) |
||||
|---|---|---|---|---|---|---|---|---|
Con. |
Opt. |
Con. |
Opt. |
Con. |
Opt. |
|||
USA |
$24,907,916 |
$39,765,269 |
90,767 |
144,908 |
7,602 |
12,137 |
4,377 |
334 |
UK |
$14,513,339 |
$23,170,418 |
140,453 |
224,231 |
2,053 |
3,278 |
4,914 |
214 |
Germany |
$7,139,955 |
$11,398,875 |
67,059 |
107,060 |
769 |
1,228 |
1,604 |
117 |
Canada |
$4,341,536 |
$6,931,224 |
7,250 |
11,575 |
1,396 |
2,229 |
541 |
46 |
Australia |
$3,456,870 |
$5,518,862 |
22,941 |
36,626 |
465 |
743 |
346 |
49 |
Sweden |
$1,439,062 |
$2,297,450 |
13,365 |
21,338 |
119 |
191 |
339 |
34 |
Spain |
$1,312,653 |
$2,095,639 |
11,231 |
17,931 |
206 |
330 |
1,213 |
31 |
France |
$1,170,680 |
$1,868,981 |
11,478 |
18,324 |
111 |
177 |
165 |
25 |
EU |
$655,093 |
$1,045,850 |
8,413 |
13,432 |
121 |
193 |
765 |
59 |
Other |
$2,487,207 |
$3,970,804 |
26,512 |
42,326 |
336 |
536 |
2,061 |
172 |
Total |
$61,424,311 |
$98,063,373 |
399,470 |
637,750 |
13,179 |
21,040 |
16,325 |
1,127 |
Note. Con. refers to the conservative estimates; Opt. refers to the optimistic estimates.
Table 6b shows that between July and November 2018, the illicit market for cannabis on cryptomarkets grew by 19% in terms of revenues. The same three countries (USA, UK, Germany) remain in the lead positions, with Canada rising to the fourth position. The volume of cannabis appears to have decreased between the two data collection events, suggesting that prices either increased internationally or that smaller but more numerous transactions occurred. The latter appears to be the most logical explanation as the number of sales increased marginally (from 547,000 to 638,000 for the optimistic scenario).
Lastly, we examined if the level of competition changed in the cannabis cryptomarket based on the Herfindahl-Hirschman Index (HHI). The HHI index is a measure of competition in a market and is one of the most commonly used measures of competition (Diallo and Tomek, 2015; Hindriks & Myles, 2006). When the HHI index is close to one, the level of competition in the market is low (monopoly), whereas when the index is close to zero (or close to one divided by the number of firms in the market), the market is considered to be highly competitive (Owen et al., 2007). Table 7 presents the HHI index for the Canadian and international cannabis markets based on the July 2018 and November 2018 datasets.
Time Point |
Herfindahl-Hirschman Index |
|
|---|---|---|
Canada |
Worldwide |
|
July 2018 (pre-legalization) |
0.0800 |
0.0005 |
November 2018 (post-legalization) |
0.1993 |
0.0062 |
Results in Table 7 show that, for the Canadian cannabis cryptomarket, the HHI index increased by about 2.5 times between July and November 2018, suggesting that, post-legalization the level of competition decreased among Canadian cryptomarket vendors, with a smaller number of Canadian vendors making a larger proportion of cannabis sales. The same can be said for the international cannabis market, but to a lesser extent (although the level of competition decreased worldwide, the low HHI score overall suggests that the international market remained competitive in November 2018). Yet, as discussed above, the number of Canadian cannabis vendors remained quite stable over time. This suggests that some Canadian vendors managed to increase their sales at the detriment of others. We noticed that half of Dream Market vendors observed in the July data collection did not have an active account in the November data collection, suggesting that new vendors may not yet have had time to leave a footprint in the market. Such results corroborate Paquet-Clouston et al.’s (2018b) conclusions that cryptomarkets have high barriers to sales: vendors can easily set up an account, but they still face difficulties in overcoming existing reputable vendors trusted by the community.
Summary of the Changes Observed in Canadian Cannabis Cryptomarkets
Changes in Canadian cannabis cryptomarkets are observed pre- and post-legalization. Sales of Canadian cannabis have increased, as has the proportion of listings that ship internationally. This is further confirmed with an observed post-legalization increase of Canadian cannabis revenues generated by listings targeting American or international customers. However, some international sales may have been conducted by domestic customers. Canadian vendors seem to tap more into the international market when compared to their counterparts operating prior legalization. Prices for Canadian cannabis are found to be much lower than American prices reported in Décary-Hétu et al. (2018). Canadian cannabis vendors also appear to have lowered their sales of other types of products, following legalization. At the same time, their share of the cannabis market has increased. Indeed, Canadian vendors have moved from eighth to fourth position for sales of cannabis on cryptomarkets following legalization, with the US, UK and Germany maintaining their leading positions. Lastly, the level of competition between Canadian cannabis vendors seems to have decreased following legalization, with, potentially, a few established Canadian vendors managing to increase their sales to a greater proportion than others. Many vendors that were active prior to legalization did not have an active account following legalization. Overall, the changes that were identified earlier show that the size and scope of Canadian vendors have increased following legalization. Of course, these observations represent tentative patterns and trends and further analysis with a longer follow-up period should be conducted to truly assess the impact of legalization on the sale of cannabis on cryptomarkets.
Insights from a Survey of Cryptomarket Vendors’ Operations
In this section, we present the results of a survey of cryptomarket vendors, with the hope of gaining further insights into how cryptomarkets operate. Of the 133 vendors who started the survey, a total of 20 vendors completed it entirely and another set of 20 answered many of the questions examined below. The response rate thus varies greatly, with some questions receiving a dozen responses and others receiving only a handful of answers, depending on the sensitivity of the topic. At the same time, these exploratory results are unique, and we know of no other survey of its kind in the grey and academic literature. To set the stage, we start by presenting aggregate survey responses of six vendors involved in the cannabis drug trade on cryptomarkets. We then look at aggregated statistics, including demographics, origin of products sold on cryptomarkets, the size and scope of cryptomarket vendors’ activities, their involvement in traditional drug dealing, and their relations to organized crime as well as their contacts’ relations to organized crime.
The Story of Six Cryptomarket Vendors
In analyzing the completed surveys, we found six different types of vendors that are described below and summarized in Figure 1. A summary of these vendors’ answers is presented in Appendix B. Given the lack of knowledge about cryptomarket vendors, these profiles are useful to get a sense of the variability of profiles that exist, make their origins and dealing profiles more concrete to readers, and inform future research on the characteristics of cryptomarket vendors and how they operate. Given the sampling approach and response rate, we cannot quantify how prevalent each profile is, nor is this our objective at this stage. We selected these case studies from the surveys that were completed and that illustrated a variety of patterns and styles as they apply to cannabis cryptomarkets.Footnote2 Note that: 1) we labeled profiles based on characteristics that stood out when examining their buying and selling patterns; 2) the first profile (the online broker) is the only one describing dealing activities that occur strictly online; and 3) the last profile (the organized group member) is one of only a handful of respondents reporting involvement in an organized group.
Figure 1: Six types of online vendors found in the survey
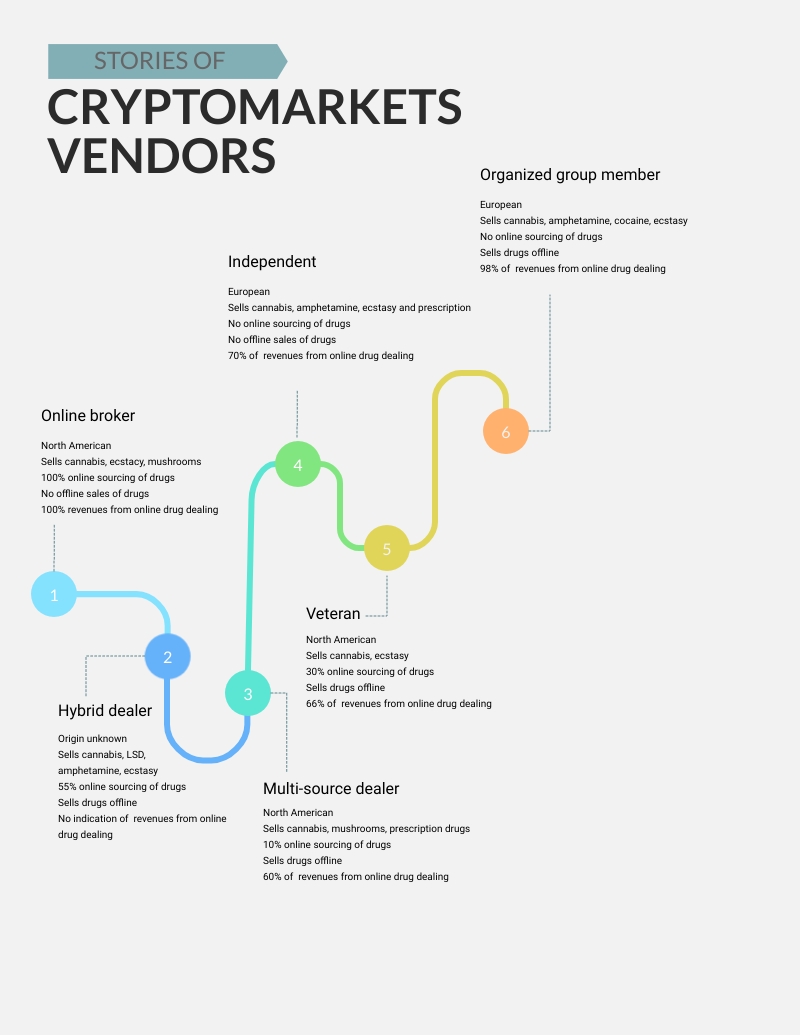
Image Description
Figure 1 provides an overview of the six types of online vendors identified in the survey. These include: (1) the online broker (North American; sells cannabis, ecstasy, and mushrooms; 100% online sourcing of drugs; no offline sales of drugs; 100% of revenues are from online drug dealing); (2) the hybrid dealer (origin unknown; sells cannabis, LSD, amphetamine, and ecstasy; 55% online sourcing of drugs; sells drugs offline; no indication of revenues from online drug dealing); (3) the multi-source dealer (North American; sells cannabis, mushrooms, and prescription drugs; 10% online sourcing of drugs; sells drugs offline; 60% of revenues from online drug dealing); (4) the independent (European; sells cannabis, amphetamine, ecstasy, and prescription drugs; no online sourcing of drugs; no offline sales of drugs; 70% of revenues from online drug dealing); (5) the veteran (North American; sells cannabis and ecstasy; 30% online sourcing of drugs; sells drugs offline; 66% of revenues from online drug dealing); and (6) the organized group member (European; sells cannabis, amphetamine, cocaine, and ecstasy; no online sourcing of drugs; sells drugs offline; 98% of revenues from online drug dealing).
The Online Broker
The online broker preferred not to give any information about their demographics, except that they operate from North America. This vendor started doing business on cryptomarkets in 2011 and sells cannabis, ecstasy, and mushrooms. The products offered are completely (100%) generated from online sources. A closer analysis of their operations reveals that they act as a broker between customers buying online and other vendors operating online. This vendor does not conduct offline drug dealing and reported that 100% of their earnings were generated from cryptomarket operations.
The Hybrid Dealer
The hybrid dealer preferred not to give any information about their demographics. They started operating on cryptomarkets in 2015 and sell principally cannabis, amphetamine, ecstasy, and LSD. Overall, 55% of the products that they sell come from online sources, with the remaining 40% from face-to-face exchanges and 5% from open public markets. Since 1996, they have also sold amphetamine and ecstasy offline as well as other drugs to personal contacts or other known vendors. This vendor does not consider themself part of an organized group and decided not to reveal information about their revenue.
The Multi-Source Dealer
The multi-source dealer decided not to reveal their demographic details, except that they have been involved in the sale of cannabis, mushrooms, and prescription drugs from North America since 2016. The products that this vendor supplied were partially from online sources (10%) or face-to-face exchanges (5%) and primarily from shopfronts (50%) and home-grown or manufactured sources (35%). This vendor has been selling offline cannabis, ecstasy, and mushrooms to personal relations or other vendors since 2007. In terms of revenue, 60% was generated from online drug dealing, 38% from legitimate sources, and 2% from offline drug dealing. This vendor also does not consider themself part of an organized group.
The Independent
The independent vendor is a male in his twenties who has a university degree and is established in Europe. In 2012, he started selling products online such as cannabis, amphetamine, ecstasy, and prescription drugs. Eighty-five percent (85%) of his products are sourced from face-to-face exchanges and 15% from home-grown or manufactured sources. He is not involved in offline drug dealing nor does he consider himself part of a criminal group. He reported that 70% of his revenue originates from online drug dealing, with the remaining 30% generated from other offline offenses.
The Veteran
The veteran is a male in his fifties with a university degree. He operates from North America and started selling products such as cannabis and ecstasy via cryptomarkets in 2014. His products are sourced 55% from face-to-face exchange, 30% from online sources, and 15% from manufactured or home-grown products. He has been selling offline cannabis and other drugs to personal relations or other known vendors since 1975. Sixty-six percent (66%) of this vendor’s revenue is generated from online drug dealing and 33% from offline drug dealing. He also does not consider himself part of an organized crime group.
The Organized Group Member
The organized group member is a male in his twenties established in Europe who has a university degree. According to his survey responses, he started selling online in 2015 and sells a variety of products, including cannabis, amphetamine, cocaine, and ecstasy. He sources the products he sells on cryptomarkets mainly through face-to-face exchanges (90%) and, to a lesser extent, from manufactured or home-grown products (10%). Since 2012, he also has sold cocaine and ecstasy to offline channels, such as personal relations or other known vendors. His yearly revenues are mainly generated from online drug dealing (98%). He considers himself part of an organized crime group.
Participants’ Demographics
The survey inquired on vendors’ gender, age, ethnicity, level of education, and the region from which they operate in the world. The responses show that the majority of respondents are Caucasian (50%), males (60%), in their thirties (M = 36; median=33), and from North America (50%). Cryptomarket vendors also appear to be relatively educated, with as many as 40% having a university degree. Vendors were also asked what kinds of drugs they sold. A total of 54% sold cannabis, 42% sold ecstasy, 29% sold cocaine, 25% sold prescription drugs, 22% sold mushrooms, 16% sold methamphetamines, 14% sold heroin, and 28% sold other kinds of drugs. Overall, we found that 37% were specialized in that they sold only one type of drug, while 57% sold between two and five types of drugs and 6% of vendors sold more than six types of drugs.
Origins of Products Sold on Cryptomarkets
By selling and sourcing solely online, cryptomarket vendors have the opportunity to take an online broker position, placing themselves in the middle of the supply process. The survey answers suggest that only 28% of vendors take this position entirely, having 100% of their products sourced from cryptomarkets or other online sources. At the other end of the distribution, 40% of vendors indicated that they never sourced their products from online channels. Only 14% of vendors indicated that they sourced their products solely through face-to-face exchanges with personal relations or known drug vendors.
A question about the proportion of drugs sold on cryptomarkets that comes from home production (manufactured or home-grown) was also included in the survey. In such contexts, vendors would vertically integrate the entire supply process, producing and directly selling to the end customer at a higher price. Only 20% of vendors replied that 100% of their drugs were sourced through the home channel, while 42% said that they did not grow or produce their products. The trend for open public markets (e.g., strangers on the street, festivals; nightclubs; or open houses) and shop fronts (e.g., adult stores; head shops; coffee shops; smoke shops; and cannabis shops) seems to be clear: for both channels, more than 80% of vendors replied that they do not use them to source their products.
These survey results suggest that drugs sold on cryptomarkets originate primarily from online sources, personal relations, known drug vendors, and/or manufactured/home-grown sources. Cryptomarket vendors do not seem to specialize in sourcing only from one channel. Instead, they interchange between these three channels, most likely indicating that they may use what is most accessible at the moment of the trade.
Size and Scope of Cryptomarket Vendor Activities
We inquired about the size and scope of cryptomarket vendor activities through questions about their revenue. Overall, 51% of vendors said that online drug dealing represented more than half of their revenues, while only 23% reported that such activity represented the total of their revenue. When questioned about the proportion of revenues that came from other online offenses and/or illegal activities, 96% reported that this proportion was nil. Similarly, 89% of vendors who replied to the question about the proportion of revenue coming from offline offenses said that it was zero. These results suggest that cryptomarket vendors do not earn revenue from other kinds of offenses, online or not. We found that 64% of vendors reported that legitimate revenues represented less than 25% of their yearly revenue. On average, cryptomarket vendors do not seem to be involved in activities that would allow them to earn a significant income from legitimate activities.
Involvement in Traditional Drug Dealing
The survey asked whether vendors conducted face-to-face drug exchanges in the past 12 months. Of all surveyed vendors, 46% participated in face-to-face exchanges. Subsequent questions were asked to vendors who conducted offline face-to-face drug exchanges. A total of 60% of the respondents were already active (in offline dealing) before the rise of the first cryptomarket, Silk Road 1.0, in 2011. The survey also inquired on the primary buyers to whom vendors sold offline drugs. A total of 91% of respondents said that they sold to personal relations or other known drug vendors. Only one respondent mentioned selling in an open public market and one other respondent sold drugs via a shop front. These results suggest that cryptomarket drug dealers involved in traditional drug dealing are mature dealers selling mainly to personal relations or other known drug vendors.
Criminal Group or Organized Crime Relationships
Once again, as the sample for this section of the survey is quite small, the results are only suggestive. Almost all survey respondents (85%) replied that they were not part of a criminal organization, while 11% replied that they were, and 4% preferred not to answer. Our results suggest organized crime vendors work with a larger number of people to conduct their operations on cryptomarkets. They worked with as many as five people, whereas non-organized crime vendors worked with an average of two people. Two-thirds of organized-crime related vendors stated that they were involved in traditional drug dealing.
All vendors were also asked to identify up to 10 contacts with whom they conducted business. The survey inquired whether these connections were related to organized crime. Of the 62 connections declared by vendors (each vendor could declare up to 10 contacts), 63% were reported as not being related to organized crime, while 18% were reported as being related to organized crime. These contacts did not necessarily come from vendors who were themselves connected to organized crime. Overall, by showing the distribution of connections among the 24 vendors who accepted to answer these questions (larger nodes below), Figure 2 illustrates that organized crime connections seem to be scattered and not prevalent among cryptomarket vendors.
Figure 2: Sociogram of Vendors’ Type of Contacts
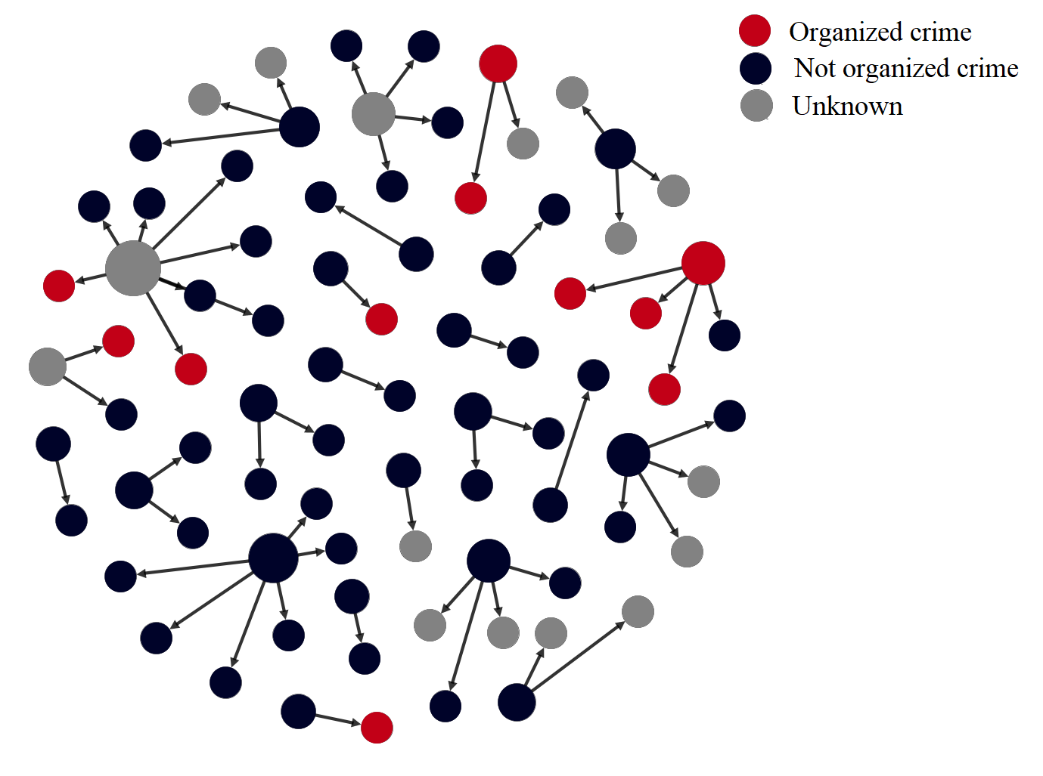
Image Description
Figure 2 contains a sociogram that illustrates whether vendors’ contacts are involved in organized crime, not involved in organized crime, or whether this information is unknown. Overall, this figure demonstrates that most vendors’ contacts are not connected to organized crime and that the organized crime connections that were reported are scattered among the cryptomarket vendors.
Summary of Online Survey Results
In the past, gaining access to networks of online drug dealers has proven difficult. In this section, we presented preliminary results from an online survey of cryptomarket vendors. Given the small sample size of survey participants, readers are invited to always keep in mind that the response rate greatly limits what we can infer from the results. Still, our results suggest that vendors vary in how they organize their activities and who they are. Typical dealers from this sample would be Caucasian, male, in their thirties and from North America. Their activities are not disconnected from traditional drug dealing. In many cases, they source or sell their drugs from face-to-face interactions and do not, for the most part, self-identify as part of an organized crime group.
Discussion and Conclusions
The general aim of this report was to understand patterns in the trade of illicit cannabis on cryptomarkets in Canada. We looked into patterns of sales at two points in 2018, prior to cannabis legalization (July 2018), and after (November 2018). Our results suggest that, over recent months, Canada may have become a more significant actor in the cryptomarket cannabis market. On an annual basis, sales generated by Canadian cannabis vendors appear to have ranged in the hundreds of thousands of dollars a year ago and may have since increased up to the millions of dollars. The volume of cannabis shipped appears to have also increased over the same period, rising from hundreds of kilograms to perhaps as much as 2,229 kilograms per year for the most optimistic model. This would be a significant increase that may have pushed Canada from the 8th to 4th position in cryptomarket rankings, according to cannabis revenues. Based on the limited data at hand and the short time frame since cannabis was regulated, it is not possible to assess whether legalization has had an impact on cryptomarket cannabis sales from Canada. Our analyses are very preliminary. However, there appears to be a correlation between pre- and post-legalization periods that should be investigated in future studies.
Potential Impact of Legalization on Domestic Market
If the increase in sales of cannabis by Canadian vendors is confirmed, it would be mainly related to sales targeting an international market. Our models suggest that the volume of cannabis sold by Canadian vendors to Canadian customers may have decreased following the legalization of cannabis. This is not surprising when considering that cryptomarket vendors now face the competition of legal retailers and that the legal price of cannabis is competitive, averaging CA$ 8.92 per gram across the country (Statistics Canada, 2019). According to Statistics Canada, such a legal price is slightly higher than the cannabis price prior to legalization. Indeed, since legalization, the price of cannabis has increased, on average, by 15% across the country, ranging from an increase of 5% to 27.7%, depending on the province (Statistics Canada, 2019). Interestingly, following legalization, we find that cryptomarket vendors appear to advertise less (and potentially sell less) at the domestic level. This implies that vendors may recognize that domestic buyers are more likely to purchase from the legal system, especially considering the additional costs that buying on cryptomarkets can incur, such as buying bitcoin or knowing how to use the Tor network. The legal price would thus be set low enough for Canadian cannabis cryptomarket vendors to offer (and conduct) international sales rather than domestic ones, recognizing that their target market is not a domestic one. The impact of legalization depends on how the market is regulated (for a review, see Kilmer, 2014) and current research findings indicate that Canadian cryptomarket vendors would shift their supply to the international market due to the legal market being competitive enough (Caulkins et al., 2012; Kilmer et al., 2010; Ouellet et al., 2017). However, this research only investigates cryptomarkets; further studies should be conducted on the traditional black market, which integrates a different supply process.
Potential Impact of Legalization on International Markets
International sales appear to have multiplied; however, other studies have found that cryptomarket transactions are more likely to take place at a regional or national level (Décary-Hétu et al., 2016; Demant et al., 2018a; Munksgaard et al., 2017; Norbutas, 2018), as vendors and buyers are more likely to trade with individuals located in the same countries to avoid risks of package interception at borders (Décary-Hétu et al., 2016; Norbutas, 2018; Volery, 2017). Based on this study’s findings and given Canadian vendors’ position to deal in a market where cannabis is legal, these vendors could thus be willing to ship at the international level to tap into other markets, while taking on more risks of package interception. Canadian vendors’ decisions to sell at the international level may be also related to the small domestic market they have to deal with. Indeed, Décary-Hétu et al. (2016) found that vendors selling in countries with a lower pool of potential drug consumers are more likely to offer international shipping. Moreover, vendors active in the cannabis trade after the legalization of cannabis appear to have increasingly concentrated their activities around cannabis. While they may be active sellers of numerous other drugs (e.g., MDMA, stimulants), the revenues they generate through the sale of those drugs appears to have dropped after legalization while their cannabis sales appear to have increased during the same time. This is an indication that cryptomarket dealers may have taken on an opportunity to capitalize on the legalization of cannabis to brand themselves internationally as a premier source of cannabis.
When considering Canadian vendors’ geographic positions, however, one clearly notices that their closest potential market is the American one. Yet, American vendors are driving the supply for cannabis: they conduct 50% of all cannabis sales and up to 32% of cannabis transactions (Décary-Hétu et al., 2018). Moreover, our study finds that they appear to have remained the top supplier pre- and post-legalization. Van Buskirk et al. (2016) hypothesized that such dominance could be explained by the legalization of cannabis in some American states, which would give vendors from these states a competitive advantage over others. The question remains whether American buyers would be willing to buy from Canadian vendors, while they have access to a large pool of domestic vendors, including some that are also dealing in States where cannabis is legalized (van Buskirk et al., 2016). Considering the large U.S. supply, American buyers may be more willing to buy from their domestic vendors and minimize the risk of transaction failures (Décary-Hétu et al., 2016; Demant et al., 2018a). This could explain why Canada appears to be in fourth position in the international cannabis market, even post-legalization. Without a doubt, cryptomarkets are competitive settings (Paquet-Clouston et al., 2018b), and even if Canadian cryptomarket vendors wish to use their advantage to tap into the international market, they may be limited by various economic forces associated with the illegal activities they are involved in (Reuter, 1983).
Sourcing Through Legal Channels and Involvement in Organized Crime
One comparative advantage that Canadian vendors now have is to potentially source their drugs from legal companies. Findings from the survey indicate that cryptomarket dealers do source their drugs offline, from various channels, such personal relations or known drug vendors and/or their drugs are manufactured/home-grown. They can now tap into the legal production of cannabis to source quality cannabis that can be sold and recognised internationally. Canadian vendors can also advertise their geographic positioning on cryptomarkets, just like what is done by American vendors who are established in states where the drug is legal (van Buskirk et al., 2016). Moreover, Décary-Hétu et al. (2018) found anecdotal evidence in American listing descriptions that legal supply was diverted to cryptomarkets and even used as a selling point since legal cannabis is usually tested and of high quality. Future studies should investigate whether Canadian cannabis dealers mention the origin of their cannabis and any connection with legal firms or strains of cannabis to understand if the rise of a licit market has been infiltrated by organized crime or other forms of criminal entrepreneurs that participate in this market.
Drug Prices
Drug prices have long been used as a proxy to understand adaptation and changes in the cannabis black market. Price is one of the few available data points in an otherwise covert network of dealers and drug users. Yet, the quality of pricing data has long been criticized in the literature (Reuter & Caulkins, 1998). Recent research (Martin et al., 2018; Mireault et al., 2018;) suggests that online and offline drug markets have converging drug prices based on location and type of drug. This research finds that Canadian cryptomarket listings of five grams and under have a mean price of US$ 19.73 and a median price of US$ 11.86 post legalization. While the exchange rate at US$ 1 dollar is approximately CA$ 1.35Footnote3, the median Canadian unit price under 5 grams would be around CA$ 16 compared to the legal price at CA$ 8.92 per gram across the country (Statistics Canada, 2019). Cryptomarket prices are thus higher than the legal price and also integrate additional costs, such as changing fiat currencies to bitcoins, which involves volatility (Dyhrberg, 2016) and potential market administrating and shipping fees. Moreover, Canadian prices, pre- or post-legalization, remain much lower than those found in Décary-Hétu et al. (2018) for cannabis prices in the United States. Depending on quantity and type of shipment, the difference between the two studies represents over 20% cheaper prices in Canada in 2018, compared to the 2016 US prices. This could be a potential comparative advantage that would help Canadian cryptomarket dealers tap into the American market. An interesting inquiry would quantify the costs related to the risks, for American customers buying from Canadian vendors compared to the price difference between the two countries.
Sales Concentrations
Perhaps the most intriguing finding from this report is the higher concentration of sales over time. Competition appears to have decreased over time in Canada, with an even more limited number of vendors controlling a sizeable portion of transactions. This creates opportunities for law enforcement to target the largest participants in the Canadian cannabis trade and disrupt a large portion of the Canadian market by making relatively few and better targeted arrests. The identification and arrest of cryptomarket drug dealers have happened relatively regularly over the past few years (Décary-Hétu & Giommoni, 2017). With a more limited pool of vendors to target, law enforcement could reduce the size of the market. Charette (2016) demonstrated that offenders are well aware of the risks they face and that they are able to adapt to police actions. As such, should law enforcement succeed in reducing trust toward Canadian dealers, it is possible that Canadian buyers would turn to licit suppliers or foreign dealers.
Limited Size and Scope of Canadian Cannabis Cryptomarkets
Overall, it is important to remember that cryptomarkets represent a new distribution channel for cannabis. However, this distribution channel is small when compared to the offline traditional cannabis market. The National Cannabis Survey estimates that over 4 million Canadians have used cannabis over a period of four months last year, suggesting that, at the very least, thousands of kilograms of cannabis were consumed during that quarter. With sales of 2,229 kilograms for the optimistic post-legalization scenario and 46 vendors, Canadian cannabis cryptomarket supply was still marginal at the end of 2018. This may be explained by distinctive features of the cannabis market. Indeed, when compared to other drugs, such as cocaine or heroin, cannabis production is known to be more extensively distributed across the globe (Boivin, 2010) and research on cannabis consumption has shown that most consumers access their drugs through social supply, by home growing it themselves, or by receiving it as a gift (Caulkins, 2007; Caulkins & Pacula, 2006). Cannabis accessibility remains relatively easy in western countries (Bouchard et al., 2011; Clements, 2006) and the comparative advantage of Canadian cannabis vendors on cryptomarkets may be limited, especially if we consider the costs of ordering cannabis through online platforms. Moreover, Norbutas’ (2018) research even indicates that most cryptomarket buyers only make a single purchase. Cryptomarkets therefore represent a useful warning gauge to understand trends in drug markets, rather than a paradigm shifting innovation as was believed when they were first launched.
Recommendations
Given these results, we can make the following recommendations for future research, with the general goal of informing research and policy on the relationship between legal and illegal sales of cannabis, both offline and online.
- While controls have been put in place to trace cannabis from a plant to a sale in commercial settings, it will be difficult to trace all cannabis produced given the right for most Canadians to grow their own limited number of plants at home. Still, efforts should be made to analyze cannabis that is seized when being shipped through the mail to link commercial cannabis production operations to cryptomarkets. These illicit markets appear to have increased their shipment of drugs over the past months and it is possible that some of the cannabis sold online was produced legally and then diverted to the black market. If confirmed, this could cause political tensions with other countries who have already complained about the impact of cannabis legalization in Canada. Efforts should therefore be made to demonstrate that the legal supply of cannabis is distinct from drugs sold illegally, especially if this supply of cannabis is to be shipped to other countries.
- Given the rise in shipments by Canadian cryptomarket cannabis dealers, efforts should be made to monitor the sales of cannabis on the cryptomarket. Should sales continue to grow, further efforts should be made to understand the structure of networks responsible for the sale of cannabis. A very limited number of vendors are often responsible for the bulk of sales for a drug in a specific country. This suggests that cryptomarkets are vulnerable to police enforcement even though cryptomarkets have shown their ability to attract new vendors when established ones are removed.
- Cryptomarkets are a relatively new distribution channel for illicit drugs. This study has found that cryptomarkets appeared to have changed around the same time as cannabis was legalized in Canada. It also found that the Canadian cannabis market on cryptomarkets is quite small. Thus, it would be interesting to monitor other types of online distribution of cannabis to understand if larger trades are happening through other technological means and whether the same change following legalization happened in other settings. This could be investigated through the monitoring of single vendor shops and small websites owned and operated by one or more individuals who sell drugs. Indeed, a large number of commercial websites that advertise the sale of cannabis often do so under the disguise of medical cannabis. These websites may have experienced an increase in sales after the legalization and could help confuse Canadians who may think these websites are providing legal cannabis when, in fact, they are supplying black market cannabis. Evaluating these websites’ trading success may be difficult given the lack of public feedbacks on their webpages. Yet, other techniques, such as open source investigative tools (e.g., Google Search Trends), offer a glimpse into the rise or fall of the Canadian black market for cannabis.
The impact of drug policies on cryptomarkets is a new and under-developed area of research. Resources should be invested in the systematic evaluation of these policies on both online and offline markets.
References
Aldridge, J., & Décary-Hétu, D. (2014). Not an Ebay for drugs': The cryptomarket 'Silk Road' as a paradigm shifting criminal innovation. Retrieved from https://ssrn.com/abstract=2436643
Aldridge, J., Stevens, A., & Barratt, M. J. (2018). Harms, benefits and the policing of cryptomarkets: A response to commentaries. Addiction, 113(5), 802-804.
Barratt, M. J., Ferris, J. A., & Winstock, A. R. (2014). Use of Silk Road, the online drug marketplace, in the United Kingdom, Australia and the United States. Addiction, 109(5), 774-783.
Barratt, M. J., Ferris, J. A., & Winstock, A. R. (2016). Safer scoring? Cryptomarkets, social supply and drug market violence. International Journal of Drug Policy, 35, 24-31.
Bloom, B. S., & Iannacone, R. C. (1999). Internet availability of prescription pharmaceuticals to the public. Annals of Internal Medicine, 131(11), 830-833.
Boivin, R. (2010). Le monde à l'envers?. Deviance et Societe, 34(1), 93-114.
Bouchard, M. (2008). Towards a realistic method to estimate the size of cannabis cultivation industry in developed countries. Contemporary Drug Problems, 35, 291-320.
Bouchard, M., & Morselli, C. (2014). Opportunistic structures of organized crime. In L. Paoli (Ed.), Handbook of organized crime (pp. 288-302). Oxford, UK: Oxford University Press.
Bouchard, M., Potter, G., & Decorte, T. (2011). Emerging trends in cannabis cultivation - and the way forward. In T. Decorte, G. Potter, & M. Bouchard (Eds). World wide weed: Global trends in cannabis cultivation and its control (pp. 273-286). London, UK: Ashgate.
Bouchard, M., Morselli, C., MacDonald, M., Gallupe, O., Zhang, S., & Farabee, D. (2018). Estimating risks of arrest and criminal populations: Regression adjustments to capture-recapture models. Crime & Delinquency. Advanced online publication.
Bradbury, D. (2013). Users track $100 million in stolen Bitcoin after sheep marketplace hack. Retrieved from https://www.coindesk.com/sheep-marketplace-track-stolen-bitcoins/
Branwen, G. (2018). Darknet market mortality risks. Retrieved from https://www.gwern.net/DNM-survival
Broadhurst, R., Grabosky, P., Alazab, M., Bouhours, B., & Chon, S. (2014). An analysis of the nature of groups engaged in cyber crime. International Journal of Cyber Criminology, 8 (1), 1-20.
Broséus, J., Rhumorbarbe, D., Mireault, C., Ouellette, V., Crispino, F., & Décary-Hétu, D. (2016). Studying illicit drug trafficking on cryptomarket markets: Structure and organisation from a Canadian perspective. Forensic Science International, 264, 7-14.
Broséus, J., Rhumorbarbe, D., Morelato, M., Staehli, L., & Rossy, Q. (2017). A geographical analysis of trafficking on a popular cryptomarket market. Forensic Science International, 277, 88-102.
Caudevilla, F., Ventura, M., Fornís, I., Barratt, M. J., Vidal, C., Quintana, P., & Calzada, N. (2016). Results of an international drug testing service for cryptomarket users. International Journal of Drug Policy, 35, 38-41.
Caulkins, J. P. (2007). Price and purity analysis for illicit drug: Data and conceptual issues. Drug and Alcohol Dependence, 90, S61-S68.
Caulkins, J. P. (2010). Estimated cost of production for legalized cannabis (RAND Working Paper WR-764-RC). RAND Drug Policy Research Center. Retrieved from https://www.rand.org/content/dam/rand/pubs/working_papers/2010/RAND_WR764.pdf
Caulkins, J. P., Hawken, A., Kilmer, B., & Kleiman, M. A. (2012). Marijuana legalization: What everyone needs to know. New York, NY: Oxford University Press.
Caulkins, J. P., & Pacula, R. L. (2006). Marijuana markets: Inferences from reports by the household population. Journal of Drug Issues, 36(1), 173-200.
Caulkins, J. P., & Reuter, P. (1998). What price data tell us about drug markets. Journal of Drug Issues, 28(3), 593-612.
Charette, Y. (2016). The impact of impunity experience on the risks of penal recidivism. Canadian Journal of Criminology and Criminal Justice, 58(4), 565-597.
Christin, N. (2013). Traveling the Silk Road: A measurement analysis of a large anonymous online marketplace. Proceedings of the 22nd International Conference on World Wide Web.
Cunliffe, J., Martin, J., Décary-Hétu, D., & Aldridge, J. (2017). An island apart? Risks and prices in the Australian cryptomarket drug trade. International Journal of Drug Policy, 50, 64-73.
Décary-Hétu, D., Paquet-Clouston, M., & Aldridge, J. (2016). Going international? Risk taking by cryptomarket drug vendors. International Journal of Drug Policy, 35, 69-76.
Décary-Hétu, D., & Giommoni, L. (2017). Do police crackdowns disrupt drug cryptomarkets? A longitudinal analysis of the effects of Operation Onymous. Crime, Law and Social Change, 67(1), 55-75.
Décary-Hétu, D., Mousseau, V., & Vidal, S. (2018). Six years later: Analyzing online black markets involved in herbal cannabis drug dealing in the United States. Contemporary Drug Problems, 45, 366-381.
Décary-Hétu, D. (2015). DATACRYPTO: A dark net crawler and scraper [computer software]. Montreal, Canada: University of Montreal.
Decorte, T., Potter, G., & Bouchard, M. (Eds). (2011). World wide weed: Global trends in cannabis cultivation and its control. London, UK: Ashgate.
Degenhardt, L., Reuter, P., Collins, L., & Hall, W. (2005). Evaluating explanations of the Australian ‘heroin shortage’. Addiction, 100(4), 459-469.
Demant, J., Munksgaard, R., Décary-Hétu, D., & Aldridge, J. (2018a). Going local on a global platform: A critical analysis of the transformative potential of cryptomarkets for organized illicit drug crime. International Criminal Justice Review, 28(3), 255-274.
Demant, J., Munksgaard, R., & Houborg, E. (2018b). Personal use, social supply or redistribution? Cryptomarket demand on Silk Road 2 and Agora. Trends in Organized Crime, 21(1), 42-61.
Department of Justice (2015). Ross Ulbricht, the creator and owner of the “Silk Road” website, found guilty in Manhattan federal court on all counts. Retrieved from https://www.justice.gov/usao-sdny/pr/ross-ulbricht-creator-and-owner-silk-road-website-found-guilty-manhattan-federal-court
Diallo, A., & Tomek, G. (2015). The interpretation of HH-Index output value when used as mobile market competitiveness indicator. International Journal of Business and Management, 10(12), 48-53.
Duxbury, S. W., & Haynie, D. L. (2018). The network structure of opioid distribution on a darknet cryptomarket. Journal of Quantitative Criminology, 34(4), 921-941.
Dyhrberg, A. H. (2016). Bitcoin, gold and the dollar–A GARCH volatility analysis. Finance Research Letters, 16, 85-92.
Gallet, C. A. (2014). Can price get the monkey off our back? A meta‐analysis of illicit drug demand. Health Economics, 23(1), 55-68.
Gagné, C. (forthcoming). Impact of a police operation on cannabis market in Canada (Unpublished Master’s thesis). University of Montreal, Montreal, Quebec.
Government of Canada (2018). Canadian Cannabis Survey 2018 summary. Retrieved from https://www.canada.ca/en/services/health/publications/drugs-health-products/canadian-cannabis-survey-2018-summary.html
Government of Canada (2019). Cannabis demand and supply. Retrieved from https://www.canada.ca/en/health-canada/services/drugs-medication/cannabis/licensed-producers/market-data/supply-demand.html
Hall, W., & Lynskey, M. (2016). Evaluating the public health impacts of legalizing recreational cannabis use in the United States. Addiction, 111(10), 1764-1773.
Hathaway, A. D., & Erickson, P. G. (2003). Drug reform principles and policy debates: Harm reduction prospects for cannabis in Canada. Journal of Drug Issues, 33(2), 465-495.
Hathaway, A. D., Mostaghim, A., Erickson, P. G., Kolar, K., & Osborne, G. (2018). “It’s really no big deal”: The role of social supply networks in normalizing use of cannabis by students at Canadian universities. Deviant Behavior, 39(12), 1672-1680.
Hindriks, J, & Myles, G. (2006). Intermediate public economics (1st Ed). London, UK: The MIT Press.
Jelsma, M., Boister, N., Bewley-Tay, D., Fitzmaurice, M., & Walsh, J. (2018). Balancing treaty stability and change: Inter se modification of the UN drug control conventions to facilitate cannabis regulation (Policy Report 7, ISSN 2054-2046). Global Drug Policy Observatory. Retrieved from http://fileserver.idpc.net/library/stability_change-inter_se_mofication_gdpo-tni-wola_march_2018.pdf
Kilmer, B., Caulkins, J. P., Pacula, R. L., MacCoun, R. J., & Reuter, P. (2010). Altered state? Assessing how marijuana legalization in California could influence marijuana consumption and public budgets. The Transnational Institute (TNI) of Research. Retrieved from https://www.tni.org/en/issues/regulation/item/627-altered-state
Kilmer, B. (2014). Policy designs for cannabis legalization: starting with the eight Ps. The American Journal of Drug and Alcohol Abuse, 40(4), 259-261.
Kovach, S. (2013). FBI says illegal drugs marketplace Silk Road generated $1.2 billion in sales revenue. Retrieved from https://www.businessinsider.com/silk-road-revenue-2013-10
Kruithof, K., Aldridge, J., Décary-Hétu, D., Megan, S., Dujso, E., & Hoorens, S. (2016). Internet-facilitated drugs trade. RAND Europe Research Report. Retrieved from http://www.rand.org/pubs/research_reports/RR1607.html
Leukfeldt, E. R., Lavorgna, A., & Kleemans, E. R. (2017). Organised cybercrime or cybercrime that is organised? An assessment of the conceptualisation of financial cybercrime as organised crime. European Journal on Criminal Policy and Research, 23(3), 287-300.
Lusthaus, J. (2013). How organised is organised cybercrime?. Global Crime, 14(1), 52-60.
MacCoun, R. J., & Reuter, P. (2011). Assessing drug prohibition and its alternatives: A guide for agnostics. Annual Review of Law and Social Science, 7, 61-78.
Maddox, A., Barratt, M. J., Allen, M., & Lenton, S. (2016). Constructive activism in the dark web: cryptomarkets and illicit drugs in the digital ‘demimonde’. Information, Communication & Society, 19(1), 111-126.
Mahamad, S., & Hammond, D. (2019). Retail price and availability of illicit cannabis in Canada. Addictive Behaviors, 90, 402-408.
Martin, J. (2014). Drugs on the dark net: how cryptomarkets are transforming the global trade in illicit drugs. London, UK: Palgrave Macmillan.
Martin, J., Cunliffe, J., Décary-Hétu, D., & Aldridge, J. (2018). Effect of restricting the legal supply of prescription opioids on buying through online illicit marketplaces: interrupted time series analysis. British Medical Journal, 361, k2270.
Masson, K., & Bancroft, A. (2018). ‘Nice people doing shady things’: Drugs and the morality of exchange in the cryptomarket cryptomarkets. International Journal of Drug Policy, 58, 78-84.
Mireault, C., Ouellette, V., Décary-Hétu, D., Crispino, F., & Broséus, J. (2016). The potential for a forensic study of drug trafficking in Canada based on data collected on online crypto-markets. Canadian Society of Forensic Science Journal, 49(4), 161-175.
Morselli, C., Paquet-Clouston, M., & Provost, C. (2017). The independent’s edge in an illegal drug distribution setting: Levitt and Venkatesh revisited. Social Networks, 51, 11-126.
Mounteney, J., Cunningham, A., Groshkova, T., Sedefov, R., & Griffiths, P. (2018). Looking to the future—more concern than optimism that cryptomarkets will reduce drug‐related harms. Addiction, 113(5), 799-800.
Munksgaard, R., & Demant, J. (2016). Mixing politics and crime–The prevalence and decline of political discourse on the cryptomarket. International Journal of Drug Policy, 35, 77-83.
Munksgaard, R., Bakken, S., & Demant, J. (2017, May). Risk perception in emerging markets for illicit substances in Scandinavia-The effect of available information through online communities. Paper presented at the Scandinavian Research Council for Criminology 59th Research Seminar, Sweden.
Nguyen, H., & Bouchard, M. (2013). Need, connections, or competence? Criminal achievement among adolescent offenders. Justice Quarterly, 30, 44-83.
Norbutas, L. (2018). Offline constraints in online drug marketplaces: An exploratory analysis of a cryptomarket trade network. International Journal of Drug Policy, 56, 92-100.
Ogrodnik, M., Kopp, P., Bongaerts, X., & Tecco, J. M. (2015). An economic analysis of different cannabis decriminalization scenarios. Psychiatria Danubina, 27(1), 309-314.
Ouellet, M., MacDonald, M., Bouchard, M., Morselli, C., & Frank. R. (2017). The price of marijuana in Canada, 2015. Ottawa, Canada: Public Safety Canada.
Owen, P. D., Ryan, M., & Weatherston, C. R. (2007). Measuring competitive balance in professional team sports using the Herfindahl-Hirschman index. Review of Industrial Organization, 31(4), 289-302.
Pacula, R. L. (2010). Examining the impact of marijuana legalization on marijuana consumption: Insights from the economics literature (RAND Working Paper WR-770-RC). RAND Drug Policy Research Center. Retrieved from https://www.rand.org/pubs/working_papers/WR770.html
Paquet-Clouston, M. C. (2017). Are cryptomarkets the future of drug dealing? Assessing the structure of the drug market hosted on cryptomarkets (Unpublished Master’s thesis). University of Montreal, Montreal, Quebec.
Paquet-Clouston, M., Autixier, C., & Décary-Hétu, D. (2018a). Comprendre les interactions des vendeurs de drogue sur les forums de discussion des cryptomarchés, Canadian Journal of Criminology and Criminal Justice, 60(4), 455-477.
Paquet-Clouston, M. Décary-Hétu, D., & Morselli, C. (2018b). Assessing market competition and vendors' size and scope on alphabay. International Journal of Drug Policy 54, 87-98.
Reuter, P. (1983). Disorganized crime: The economics of the visible hand. Cambridge, MA: MIT Press.
Reuter, P., & Kleiman, M. A. (1986). Risks and prices: An economic analysis of drug enforcement. Crime and Justice, 7, 289-340.
Rost, K. T. (2000). Policing the wild west world of internet pharmacies. Chicago-Kent Law Review, 76(2), 1333-1361.
Soska, K., & Christin, N. (2015). Measuring the longitudinal evolution of the online anonymous marketplace ecosystem (pp. 33-48). Proceedings of the 24th USENIX Security Symposium. Retrieved from https://www.usenix.org/system/files/conference/usenixsecurity15/sec15-paper-soska-updated.pdf
Statistics Canada (2018). Cannabis economic account, 1961 to 2017. The Daily. Statistics Canada. Retrieved from https://www150.statcan.gc.ca/n1/daily-quotidien/180125/dq180125c-eng.htm
Statistics Canada (2019). Price of dried cannabis by province, pre-legalization and post-legalization. The Daily. Statistics Canada. Retrieved from https://www150.statcan.gc.ca/n1/daily-quotidien/190410/t003c-eng.htm
van Buskirk, J., Naicker, S., Roxburgh, A., Bruno, R., & Burns, L. (2016). Who sells what? Country specific differences in substance availability on the Agora cryptomarket. International Journal of Drug Policy, 35, 16-23.
van der Gouwe, D., Rigter, S., & Brunt, T. M. (2018). Focus on cryptomarkets and online reviews too narrow to debate harms of drugs bought online. Addiction, 113(5), 798-799.
van Hout, M. C., & Bingham, T. (2013a). ‘Silk Road’, the virtual drug marketplace: A single case study of user experiences. International Journal of Drug Policy, 24(5), 385-391.
van Hout, M. C., & Bingham, T. (2013b). ‘Surfing the Silk Road’: A study of users’ experiences. International Journal of Drug Policy, 24(6), 524-529.
van Hout, M. C. and Bingham, T. (2014). Responsible vendors, intelligent consumers: Silk Road, the online revolution in drug trading. International Journal of Drug Policy, 25(2), 183-189.
Volery, R. (2015). Vente de drogues sur les cryptomarchés: techniques d’envoi et transmission des connaissances. Mémoire de maitrise, École des sciences criminelles, Université de Lausanne.
Appendix A
Listings Field Name |
Description |
|---|---|
PID |
Unique identifier |
MARKETID |
Unique identifier of the cryptomarket |
TITLE |
Title of the listing |
DESCRIPTION |
Description of the listing |
PRICE |
Price of the listing in USD converted based on the date of data collection |
HISTORICAL_PRICE |
Median price of all prices collected for the listing |
VOLUME |
Volume (or number) of listing |
SHIP_FROM |
Country where the listing is offered from |
SHIP_FROM_REGION |
Region where the listing is offered from |
SHIP_FROM_CONTINENT |
Continent where the listing is offered from |
SHIP_TO |
Country where the listing is offered |
SHIP_TO_REGION |
Region where the listing is offered |
SHIP_TO_CONTINENT |
Continent where the listing is offered |
SID |
Unique identifier of the vendor |
CATEGORY_GENERAL |
General category of the listing |
CATEGORY_MID |
Mid-level category of the listing |
CATEGORY_SPECIFIC |
Specific category of the listing |
VARIA |
Other information available that varies from cryptomarket to cryptomarket |
Vendor Field Name |
Description |
|---|---|
SID |
Unique identifier |
USERNAME |
Username of the vendor |
DESCRIPTION |
Profile description |
RATING |
Rating on a scale of 1 to 5 |
JOIN_DATE |
Date when the vendor account was created |
LAST_SEEN |
Date when the vendor last logged in |
VARIA |
Other information available that varies from cryptomarket to cryptomarket |
Feedback Field Name |
Description |
|---|---|
ID |
Unique identifier |
PID |
Unique identifier of the product associated to that feedback |
SID |
Unique identifier of the vendor associated to that feedback |
DATE |
Date that the feedback was posted on the cryptomarket |
USERNAME |
Username (partial or complete) of the buyer |
RATING |
Rating (1-5 stars) |
DESCRIPTION |
Qualitative rating of the buyer |
Appendix B
Factor |
The Online Broker |
The Hybrid Dealer |
The Multi-Source Dealer |
The Independent |
The Veteran |
The Organized Group Member |
|---|---|---|---|---|---|---|
Gender |
- |
- |
- |
Male |
Male |
Male |
Age |
- |
- |
- |
20-30 |
50-60 |
20-30 |
Degree |
- |
- |
- |
University Degree |
University Degree |
University Degree |
Continent |
North America |
- |
North America |
Europe |
North America |
Europe |
Year started selling online |
2011 |
2015 |
2016 |
2012 |
2014 |
2015 |
Types of drug sold online |
Cannabis, ecstasy, mushrooms |
Cannabis, amphetamine, ecstasy, LSD |
Cannabis, mushroom, prescription |
Cannabis, amphetamine, ecstasy, prescription |
Cannabis, ecstasy |
Cannabis, amphetamine, cocaine, ecstasy |
Source of products sold |
100% online |
55% online, 40% face-to-face exchange, 5% open public markets |
10% online, 5% face-to-face exchange, 50% from shopfronts, 35% manufactured or home-grown |
85% face-to-face exchange, 15% manufactured or home-grown |
30% online, 55% face-to-face exchange, 15% manufactured or home-grown |
90% face-to-face exchange, 10% manufactured or home-grown |
Selling drugs offline |
No |
Yes |
Yes |
No |
Yes |
Yes |
Year started to sell offline |
N/A |
1996 |
2007 |
N/A |
1975 |
2012 |
Types of drug sold offline |
N/A |
Amphetamine, cannabis, ecstasy, other drugs |
Cannabis, ecstasy, mushroom |
N/A |
Cannabis, other drugs |
Cocaine, ecstasy |
Kinds of customers offline |
N/A |
Personal relations or other known drug vendors |
Personal relations or other known drug vendors |
N/A |
Personal relations or other known drug vendors |
Personal relations or other known drug vendors |
Distribution of yearly revenues |
100% online drug dealing |
- |
60% online drug dealing, 2% offline drug selling, 38% from legitimate sources |
70% from online drug dealing, 25% from other offline offenses |
66% from online drug dealing, 33% from offline drug dealing |
98% from online drug dealing, 2% from offline drug dealing |
Part of a criminal group |
No |
No |
No |
No |
No |
Yes |
Footnotes
- 1
Information on legalization frameworks for each province is available at https://www.canada.ca/en/health-canada/services/drugs-medication/cannabis/laws-regulations/provinces-territories.html
- 2
Ideally, we would have automated this process via cluster analytic methods, but the sparse data were not amenable to such analyses.
- 3
Exchange rate was extracted from https://www.xe.com/currencyconverter/convert/?Amount=1&From=USD&To=CAD on May 31st, 2019
- Date modified: