Behaviours and Beliefs Related to Cannabis Before Legalization: A Public Safety Perspective
 Behaviours and Beliefs Related to Cannabis Before Legalization: A Public Safety Perspective - PDF Version (951 KB)
 Table of contents
by Karen Koundakjian
Anton Maslov
Holly Ellingwood
Executive Summary and Highlights
Over the past few years, the government of Canada has been preparing to legalize, regulate and restrict access to non-medical cannabis. In 2016, the Task Force on Cannabis Legalization and Regulation identified nine policy objectives, which served as a basis for the recent legalization. Three of the main policy objectives that are of particular importance to Public Safety Canada’s mandate are 1) “protect young Canadians by keeping cannabis out of the hands of children and youth;” 2) “keep profits out of the hands of criminals, particularly organized crime;” and 3) “protect public health and safety by strengthening, where appropriate, laws and enforcement measures that deter and punish more serious cannabis offences, particularly selling and distributing to children and youth, selling outside of the regulatory framework, and operating a motor vehicle while under the influence of cannabis.” (McLellan et al, 2016: 11)
Understanding the changes in perceptions and behaviours of those who use cannabis before and after the change in regime is important, as it will help to develop public safety policy and program initiatives, including education and crime prevention activities. Using the 2017 Canadian Cannabis Survey (CCS), the following report presents analyses of self-reported behaviours of those who used cannabis for non-medical purposes (cannabis use for non-medical purposes is defined as use for a range of non-medical reasons) in the past 12 months. The 2017 CCS asked respondents about their driving habits after cannabis use, cannabis use in combination with alcohol or other drugs, interaction with police services because of possession of cannabis, sources of cannabis (i.e., where users obtained their cannabis), methods of consumption, as well as the price they paid for their cannabis and the amount of cannabis they consumed.
The analyses highlight a number of important findings, which will serve as a benchmark for future studies examining the trends following the implementation of the law in the fall of 2018. In particular, the results of the 2017 CCS show:
- Twenty-two percent (22%) of survey respondents reported having used cannabis in the 12 months prior to the survey. Among respondents who used cannabis, the most common methods of consumption were smoking (94%), eating (34%), using a vaporizer and vape pen or e-cigarette (14% each).
- Methods of consuming cannabis differed by age group; however younger respondents who used cannabis most often utilized different ways of consuming, as compared with their older counterparts.
- Among those who used cannabis, the most frequent sources of cannabis were from a family member or friend (27%); shared amongst a group of friends (25%); acquaintance (23%); dealer or storefront dispensary (20%).
- Compared to their older counterparts, younger respondents who used cannabis were: 1) almost twice as likely to report having obtained it by sharing with a group of friends; and 2) most often reported obtaining cannabis from a dealer or a storefront dispensary.
- Although the majority of respondents agreed that using cannabis for non-medical purposes impairs a person’s ability to drive a vehicle, nearly one-quarter (22%) nonetheless reported having driven within 2 hours of using cannabis.
- Frequent users of cannabis most often presented unsafe behaviours related to drug-impaired driving. Frequent cannabis users not only believed that cannabis does not impair driving, but were also the group most often to report having driven within 2 hours of using cannabis, as well as having been a passenger with someone who used cannabis within 2 hours of driving.
- Just over one-quarter of respondents aged 16 to 19 (28%), followed by those aged 55+ (30%) indicated having driven a motor vehicle within 2 hours of using non-medical cannabis, which represents the two groups to least often report having done so.
- A very small proportion of respondents who used cannabis reported having had interactions with police for their possession of non-medical cannabis (2%).
- Earlier age of cannabis initiation affects the quantity of cannabis consumed; the earlier the age at which someone first tried or started using cannabis, the more likely they are to report a higher daily quantity of cannabis consumed over the last 12 months.
- The greatest daily amounts of cannabis consumption for non-medical purposes were reported by those who: 1) grew their own cannabis; 2) obtained it from a dealer or storefront dispensary; and 3) obtained it from a Health Canada licensed producer by mail order.
Author’s Note
The views expressed are those of the authors and do not necessarily reflect those of Public Safety Canada. Correspondence concerning this report should be addressed to:
Research Division, Public Safety Canada
340 Laurier Avenue West
Ottawa, Ontario
K1A 0P8
Email: PS.CPBResearch-RechercheSPC.SP@ps-sp.gc.ca
Acknowledgements
The authors would like to thank colleagues from Health Canada and the Drug Policy Division within Public Safety Canada for their feedback on this report.
Introduction
Cannabis is the most commonly used drug in Canada. According to 2015 results of the Canadian Tobacco Alcohol and Drugs Survey (CTADS), 12.3% of Canadians said they used cannabis in the 12 months preceding the survey, and 44.5% said they used the substance in their lifetime.Footnote1 Over the past few years, the government of Canada has been preparing to legalize, regulate and restrict access to non-medical cannabis. In 2016, the final report of the Task Force on Cannabis Legalization and Regulation identified nine policy objectives, which served as a basis for the recent legalization (McLellan et al, 2016: 11).Footnote2 Three of the main policy objectives that are of particular importance to Public Safety Canada’s mandate are 1) “protect young Canadians by keeping cannabis out of the hands of children and youth;” 2) “keep profits out of the hands of criminals, particularly organized crime;” and 3) “protect public health and safety by strengthening, where appropriate, laws and enforcement measures that deter and punish more serious cannabis offences, particularly selling and distributing to children and youth, selling outside of the regulatory framework, and operating a motor vehicle while under the influence of cannabis.” (Ibid).
The Department of Public Safety Canada has been the lead, with collaboration from key partners, on law enforcement and training, related to both the new law on cannabis legalization (former Bill C-45), and the new and strengthened impaired driving legislation (former Bill C-46). In keeping with its mandate, the Department of Public Safety Canada aims to contribute to the safety and security of all Canadians, and under the new regime of legalization, this will continue to be a priority.
An important aspect of understanding the extent to which policy has an impact on society is to measure the key indicators before and after introduction of the policy (Maslov, Lawrence & Ferguson, 2016; McLellan et al, 2016). Understanding the changes in perceptions and behaviours of people who use cannabis before and after the change in regime is important, as it will help to develop public safety policy and program initiatives, including education and crime prevention activities.
Data Source - 2017 Canadian Cannabis Survey
The 2017 Canadian Cannabis Survey (CCS) was developed through a collaboration between Public Safety Canada and Health Canada, with a view to collecting detailed information on cannabis use in Canada before legalization. In particular, CCS participants were asked about their driving habits after cannabis use, cannabis use in combination with alcohol or other drugs, interaction with police services because of possession of cannabis, sources of cannabis (i.e., where users obtained their cannabis), methods of consumption, as well as the price they paid for their cannabis and the amount of cannabis they consumed. The CCS was designed to fulfill certain quota requirements for people who used cannabis in the 12 months prior to the survey. Therefore, due to a potential participation bias, the survey is not meant to provide general population prevalence estimates for cannabis use, but rather to obtain detailed information about the habits of respondents who said they used cannabis and behaviours relating to their cannabis use. Consequently, a higher proportion of survey respondents reported having used cannabis in the past 12 months, than those from the Canadian Tobacco, Alcohol and Drugs Survey (CTADS) (22% vs 12.3%).Footnote3
The analyses that follow describe the self-reported behaviors of cannabis users for non-medical purposes (cannabis use for non-medical purposes is defined as use for a range of non-medical reasons (e.g., socially for enjoyment, pleasure, amusement or for spiritual, lifestyle and other non-medical reasons) in the 12 months prior to the survey.
The survey collected data from March 13, 2017 to May 24, 2017. In total, 9,215 respondents aged 16 years and older across all provinces and territories responded to the online survey. The sample included responses from 2,650 people who said that they had used cannabis in the 12 months prior to the survey for either non-medical or medical purposes. It should be noted that although the CCS included questions on cannabis use for medical purposes, the analyses within this report only focus on cannabis use for non-medical purposes..Footnote4
Survey findings and results presented in this report represent only significant associations which were determined through chi-square tests and Analysis of Variance depending on the type of outcome variable. All data were weighted by region, age groups, and gender. The percentages presented in the text are weighted and cannot be replicated by dividing the raw numbers from the tables in the annex by the total number of respondents. Unweighted (raw) numbers are provided in the tables at the end of each section of the paper.Footnote5
Methods of Cannabis Consumption
There are four main methods of ingesting cannabis: inhalation, oral, sublingual, and topical. Certain methods of consumption pose increased risk of accidental or unintentional ingestion, particularly by children (McLellan et al., 2016). For instance, some edible products are virtually identical to candy or baked goods that might be more appealing to children and youth and could be mistakenly ingestedFootnote6. In other circumstances, the effects of ingesting cannabis may be delayed resulting in the user to take more, thereby accidentally overdosing. As such, it is important to ensure that the public is properly educated about the different effects and risks associated with the different methods of cannabis consumption; for example, the longer time of onset associated with edible versus smoked products.
Given that the sale of edible cannabis products will not be legal immediately, evidence-based analysis of consumption methods could affect how certain products (e.g., edibles) are regulated in the future, resulting in potential changes for how edibles containing cannabis and cannabis concentrate could be sold.
ResultsFootnote7
The most common method of consumption reported by 94% of those who used cannabis in the 12 months prior to the survey was smoking.Footnote8 In addition, one-third (34%) of those who used cannabis indicated they had eaten cannabis in food, followed by 20% who said they had used a vape pen or e-cigarette and 14% who reported using a vaporizer (see tables 1-6 in the Annex).
More men report smoking, using a vaporizer, vape pen/e-cigarette and dabbing non-medical cannabis
More men who used cannabis than women, indicated having consumed non-medical cannabis in the past 12 months by smoking it (96% versus 91%), using a vaporizer (17% versus 11%), using a vape pen/e-cigarette (23% versus 17%) and by dabbing it (13% versus 8%).Footnote9
There were no significant differences between men and women for consuming non-medical cannabis by means of eating or drinking it.
Methods of consuming cannabis differ by age group
Significant age differences were noted for methods of consuming non-medical cannabis. Those aged 20 to 24 (98%) and 16 to 19 (97%) most often smoked non-medical cannabis in the past 12 months (Chart 1).Footnote10 Respondents 55+ who used cannabis were the group least likely to have smoked non-medical cannabis (88%).
Those aged 20 to 24 (45%) were the group most often to have eaten non-medical cannabis in the past 12 months. Respondents 45 to 54 and 55+ (26% each) who used cannabis, proportionately less often reported eating it.
Respondents aged 20 to 24 and 25 to 34 most often indicated having consumed non-medical cannabis through a vaporizer (18% each). The youngest respondents (16 to 19) represented the smallest proportion of those who indicated having used a vaporizer to consume cannabis (10%).
Those aged 20 to 24 (28%) most often reported using a vape pen/e-cigarette to consume non-medical cannabis in the past 12 months. Respondents aged 55+ (14%) represented the smallest proportion of those who used a vape pen/e-cigarette. Footnote11
Although a smaller proportion of respondents indicated they dabbed as a method of consuming cannabis, the youngest respondents (16 to 19) most often reported using this method (26%), followed by those aged 20-24 (21%).Footnote12
Chart 1: Methods of consumption by age category
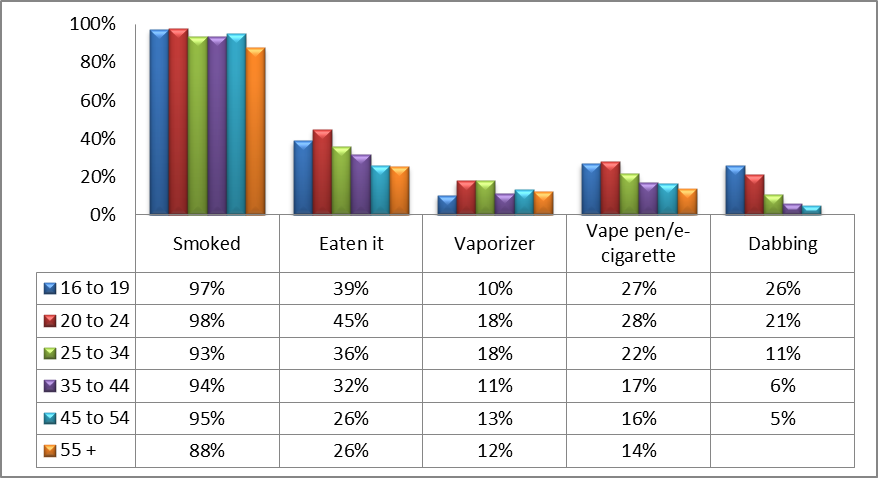
Image Description
Chart 1 is a bar chart describing the methods of consumption by age category.
The y-axis represents percentages, while the x-axis represents methods of consumption. Differently-coloured bars represent different age groups.
The first set of bars represents the method of consumption “smoked.” From the left-hand side, the percentages for those who reported smoking as a method of consumption are as follows: 97% of those who are 16-19 years old; 98% of those who are 20-24 years old; 93% of those who are 25-34 years old; 94% of those who are 35-44 years old; 97% of those who are 45-54 years old; and 88% of those who are 55 years of age and older.
The second set of bars represents the method of consumption “eaten.” From the left-hand side, the percentages for those who reported eating as a method of consumption are as follows: 39% of those who are 16-19 years old; 45% of those who are 20-24 years old; 36% of those who are 25-34 years old; 32% of those who are 35-44 years old; 26% of those who are 45-54 years old; and 26% of those who are 55 years of age and older.
The third set of bars represents the method of consumption “vaporized.” From the left-hand side, the percentages for those who reported vaporized as a method of consumption are as follows: 10% of those who are 16-19 years old; 18% of those who are 20-24 years old; 18% of those who are 25-34 years old; 11% of those who are 35-44 years old; 13% of those who are 45-54 years old; and 12% of those who are 55 years of age and older.
The fourth set of bars represents the method of consumption “vape pen/e-cigarette.” From the left-hand side, the percentages for those who reported vape pen/e-cigarette as a method of consumption are as follows: 27% of those who are 16-19 years old; 28% of those who are 20-24 years old; 22% of those who are 25-34 years old; 17% of those who are 35-44 years old; 16% of those who are 45-54 years old; and 14% of those who are 55 years of age and older.
The fifth and final set of bars represents the method of consumption “dabbing.” From the left-hand side, the percentages for those who reported dabbing as a method of consumption are as follows: 26% of those who are 16-19 years old; 21% of those who are 20-24 years old; 11% of those who are 25-34 years old; 6% of those who are 35-44 years old; and 5% of those who are 45-54 years old.
Source: 2017 Canadian Cannabis Survey
Methods of consumption differ by region
Respondents from Quebec who used cannabis represented the largest proportion (98%) who indicated they had smoked non-medical cannabis in the past 12 months. Respondents living in Western Canada who used cannabis represented the smallest, yet nonetheless significant proportion (92%) who indicated they had smoked cannabis.
There were also significant differences between regions in the proportion of those indicating that they had eaten non-medical cannabis. Respondents living in Western Canada and Ontario (38% each) who used cannabis, most often reported consuming it in this manner. Respondents in Quebec represented the smallest proportion to report eating cannabis (18%).
Although there were much smaller proportions of respondents indicating they had drunk cannabis, there were nonetheless significant differences between regions. Respondents living in Western Canada and Ontario (5% each) who used cannabis, most often reported consuming cannabis in this manner.Footnote13 Respondents in Quebec represented the smallest proportion of those who drank it (2%)Footnote13.
As with the other methods of consumption reported thus far, respondents living in Western Canada and Ontario who used cannabis most often reported consuming non-medical cannabis through a vaporizer (17% each); 24% living in Western Canada and 22% living in Ontario who used cannabis reported using a vape pen/e-cigarette. Respondents in Quebec who used cannabis, represented the smallest proportion to use a vaporizer (5%)Footnote14 , or a vape pen or e-cigarette (9%).
Dabbing was more commonly used amongst those living in Western Canada and in the Atlantic region (15% each). Respondents living in Quebec were the least likely to report having consumed cannabis in the past 12 months through dabbing (6%)Footnote14.
Frequent users of cannabis most often consume it through a number of different methodsFootnote15
The most frequent users of non-medical cannabis most often reported having smoked non-medical cannabis (99%) compared with occasional users (94%) and infrequent users (90%).
Frequent users most often (43%) reported having eaten non-medical cannabis compared with occasional users (36%) and infrequent users (26%).
Although there were much smaller proportions of respondents indicating they had drunk cannabis, there were nonetheless significant differences between types of users. Frequent users (9%) most often reported consuming cannabis in this manner, followed by occasional (3%)Footnote14 and infrequent users (1%)Footnote14.
As with the other methods of consumption discussed thus far, frequent users were the group most often to report using a vaporizer (25%) and a vape pen/e-cigarette (32%). Occasional and infrequent users reported using a vaporizer (14% and 6% respectively) or a vape pen/e-cigarette (21% and 11%) to consume non-medical cannabis.
Finally, dabbing as a method to consume non-medical cannabis in the past 12 months differed significantly across user types. In particular, frequent users most often (24%) reported using this method for consuming non-medical cannabis than both occasional (8%) and infrequent users (2%)Footnote14.
Chart 2: Methods of consumption by type of user
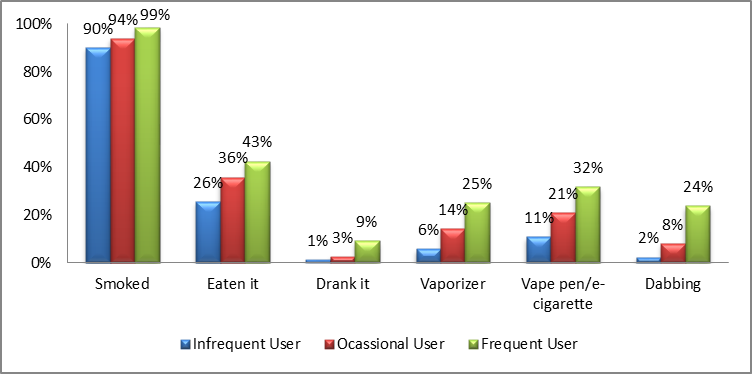
Image Description
Chart 2 is a bar chart describing the methods of consumption by type of user.
The y-axis represents percentages, while the x-axis represents methods of consumption. Differently-coloured bars represent different types of users.
The first set of bars represents the method of consumption “smoked.” From the left-hand side, the percentages for those who reported smoking as a method of consumption are as follows: 90% of infrequent users; 94% of occasional users; and 99% of frequent users.
The second set of bars represents the method of consumption “eaten.” From the left-hand side, the percentages for those who reported eating as a method of consumption are as follows: 26% of infrequent users; 36% of occasional users; and 43% of frequent users.
The third set of bars represents the method of consumption “drank it.” From the left-hand side, the percentages for those who reported drinking as a method of consumption are as follows: 1% of infrequent users; 3% of occasional users; and 9% of frequent users.
The fourth set of bars represents the method of consumption “vaporizer.” From the left-hand side, the percentages for those who reported vaporizer as a method of consumption are as follows: 6% of infrequent users; 14% of occasional users; and 25% of frequent users.
The fifth set of bars represents the method of consumption “vape pen/e-cigarette.” From the left-hand side, the percentages for those who reported vape pen/e-cigarette as a method of consumption are as follows: 11% of infrequent users; 21% of occasional users; and 32% of frequent users.
The sixth and the final set of bars represents the method of consumption “dabbing.” From the left-hand side, the percentages for those who reported dabbing as a method of consumption are as follows: 2% of infrequent users; 8% of occasional users; and 24% of frequent users.
Source: 2017 Canadian Cannabis Survey
Occasional users of cannabis before going to, or while at school most often report eating cannabis and using a vaporizer as methods of consumptionFootnote16
Occasional users of cannabis before going to, or while at school (57%) most often reported eating cannabis in food, followed by infrequent (45%) and frequent (40%)Footnote17 users. Somewhat surprising is that this method is used more by infrequent users than frequent users of cannabis.
Occasional users of cannabis before going to, or while at school most often reported using a vaporizer (22%) more than frequent (19%) and infrequent (13%) users Footnote17. Similarly, occasional users before going to, or while at school most often reported using a vape pen or e-cigarette (43%) compared with both frequent (33%) and infrequent (29%) users Footnote17.
Over one-third of frequent users (35%) reported dapping cannabis before going to, or while at school compared with 34% of occasional users and 18% of infrequent users Footnote17.
Frequent users of cannabis before going to, or while at work most often reported eating, drinking, using a vaporizer and dabbing as methods of cannabis consumption
A greater proportion of frequent users of cannabis before going to, or while at work reported eating cannabis (45%), followed by occasional users (43%). Just less than one-third (32%) of infrequent users reported eating non-medical cannabis.
The proportion of frequent users of cannabis before going to, or while at work who drank cannabis (13%) was greater than those who occasionally or infrequently used before going to, or while at school (9% and 5% respectively).Footnote18
Frequent users of cannabis before going to, or while at work (34%) most often reported using a vaporizer as a method of consuming non-medical cannabis as compared with occasional (21%) and infrequent (14%) users18. Similarly, frequent users before going to, or while at work (33%) most often reported using a vape pen or e-cigarette compared with both occasional (28%) and infrequent (17%) users.
Finally, a greater proportion of frequent users of cannabis before going to, or while at work reported dabbing cannabis (38%), followed by occasional users (22%)18 and infrequent users (15%).
Sources of Cannabis
Two of the major objectives of the new regulatory framework are to reduce the involvement of organized crime in the cannabis industry and keep cannabis out of the hands of children and youth. Most, if not all jurisdictions have already passed legislation related to the access and regulation of cannabis, however rules and regulations will differ across Canada. All of the provinces and territories set the age limit for possession and consumption of cannabis products at 19, with the exception of Quebec and Alberta, where it is set at 18 (CCSA, 2018). Provincial and territorial government organizations will oversee the sale of cannabis in all jurisdictions (CCSA, 2018). Private sales will be allowed in all of the jurisdictions except for Prince Edward Island, Nova Scotia, New Brunswick, and Quebec (CCSA, 2018). Personal cultivation will be allowed in all jurisdictions (up to four plants per household), except for Quebec, Manitoba, and Nunavut (CCSA, 2018). Consumption of cannabis in public will be prohibited in most of the provinces and territories, except for Quebec, Alberta and most recently Ontario, where public consumption in limited areas will be permitted (CCSA, 2018).
Having solid measures of the sources of cannabis is important because a good understanding of the underlying patterns of sourcing cannabis could serve as an essential indicator for the involvement of organized crime in the illicit cannabis industry. Having pre-legalization estimates of sources of cannabis will help determine the potential vulnerable populations (e.g., youth, heavy users) that the legalized regime would need to address and aid.
Results
The 2017 CCS asked respondents the following question: “In the past 12 months from whom did you usually obtain the cannabis you used for non-medical purposes from?”
Based on results from the 2017 CCS, the most frequent sources of cannabis among respondents who indicated they used it in the 12 months prior to the survey was from a family member or a friend (27%); shared around a group of friends (25%); from an acquaintance (23%); from a dealer or storefront dispensary (20%); Health Canada licensed producer by mail order (2%); grown for them (2%); and grew their own (1%).Footnote19, Footnote20
According to the National Cannabis Survey (NCS),Footnote21 just under one-third of respondents (31%) reported obtaining cannabis they used from a family member or friend; 22% reported sharing among a group of friends. The same proportion of respondents reported obtaining cannabis from a dealer and a storefront dispensary (both 19%), and from an acquaintance (20%). Fourteen percent of respondents reported obtaining the cannabis they used through an online licensed producer, and 9% of respondents said they grew the product themselves or had someone else grow it for them.Footnote22
Table 7 in the Annex contains all of the following results, including results for chi-square tests.
Women obtain cannabis from friends or family; men from a dealer
Men who used cannabis more often than women, obtained their cannabis from a dealer or a storefront dispensary (23% vs. 15%). Women on the other hand, more often than men, obtained their cannabis from a family member or a friend (33% vs. 22%). Other notable sources of cannabis do not present substantial difference between the two sexes. A comparable percentage of men (26%) and women (24%) obtained cannabis when it was shared among a group of friends, or from an acquaintance (25% and 21% respectively).
Sources of cannabis differ by age group
Obtaining cannabis while it was shared around a group of friends is more common among younger rather than older respondents who said they used cannabis. For example, when compared to their older counterpart (55+), a much higher proportion of younger respondents (16 to 19 years old) said they obtained cannabis when it was shared around a group of friends (36% vs. 17%).Footnote23 In a similar vein, obtaining cannabis from a dealer or a storefront dispensary is also much more common among younger rather than older respondents. As such, compared to older (55+) respondents, a much higher proportion of younger respondents (16 to 19 years old) said they obtained from a dealer or a storefront dispensary (27% vs. 12%).Footnote24
On the other hand, higher proportion of older respondents, when compared to their younger counterparts, said they obtained their cannabis from a family member or a friend, or from an acquaintance. As such, when compared to younger (16 to19 years old) respondents, a higher proportion of older (55+) respondents said they obtained cannabis from a family member or a friend (33% vs 21%) or from an acquaintance (30% vs 12%)Footnote24 .
Respondents from Quebec and Atlantic Canada who use cannabis less often obtain it from a dealer
Quebec respondents who used cannabis more often obtained it while it was shared among friends (30% vs 25% in Atlantic Canada; 24% in Ontario; and 24% in Western Canada), as well as from acquaintances (35% vs 24% in Atlantic Canada; 21% in Western Canada; and 20% in Ontario). However, respondents in Quebec compared with all other Canadian regions less often obtained cannabis from a family member or a friend (18% vs 31% in Atlantic Canada; 30% in Western Canada; and 28% in Ontario), or from a dealer or storefront dispensary (13% vs 15% in Atlantic Canada; 22% in Ontario; and 21% in Western Canada).
Sources of cannabis differ by frequency of use
Infrequent and occasional users tended to access their cannabis mainly when it was shared among a group of friends (40% and 20% respectively) and from a family member or a friend (30% each). In comparison, 9% of frequent users obtained cannabis when it was shared around friends, and further 20% obtained it from a family member or a friend. On the other hand, over one-third (36%) of frequent users sourced their cannabis from a dealer or a storefront dispensary (9% of infrequent and 17% of occasional users have done so), and 27% obtained cannabis from an acquaintance (17% of infrequent and 29% of occasional users have done so).
Those with problematic use of cannabis most often obtain it from a dealer
Respondents were asked about more serious signs of problematic use of cannabis, such as starting their mornings using cannabis or spending an excessive number of hours per day being “stoned”.Footnote25 Overall, 63% of those who used cannabis in the past 30 days said they did not start any mornings using cannabis in the 30 days prior to the survey. However, 16% started mornings using cannabis on 1 to 3 days in the same time period; 10% 1 to 4 days per week; and 11% on at least 5 days per week to daily. Regarding hours “stoned” on a typical day when using cannabis, 19% said they spent less than 1 hour; 67% 1 to 4 hours; and 14% 5 hours to more than 7 hours being “stoned.”
Those who reported more serious signs of problematic cannabis use obtained their cannabis from a dealer or storefront dispensary more frequently than those who reported less serious signs of problematic use. As such, between one-third and one-half of those who used cannabis who, in the 30 days prior to the survey, started mornings using cannabis on a daily basis (38%), 5 to 6 days per week (48%),Footnote26 3 to 4 days per week (45%), and 1 to 2 days per week (39%) obtained their cannabis from a dealer or storefront dispensary.Footnote27 In comparison, less than one-third of respondents who started their mornings using cannabis in the 30 days prior to the survey 1 day (33%), 2 to 3 days (30%), or have not done so (21%), also obtained their cannabis from a dealer or storefront dispensary.
A similar observation emerges when considering another possible indicator of problematic use: those who were high for 7 hours or more (45%), 5 to 6 hours (39%), and 3 to 4 hours (30%) most often obtained their cannabis from a dealer or a storefront dispensary compared with those who were “stoned” or “high” 1 to 2 hours (23%) or less than 1 hour (17%) (Chart 3).
On the other hand, respondents who used cannabis and reported fewer signs of problematic use most often accessed cannabis when it was shared around a group of friends, or from a family member or a friend. In particular, 21% who had not started their mornings using cannabis in the 30 days prior to the survey, accessed cannabis by sharing it around a group of friends, compared with 9%Footnote28 who started their mornings using cannabis on a daily basis. Further, over one-quarter of those who used cannabis (28%) who had not started their mornings using cannabis in the 30 days prior to the survey, obtained cannabis from a family member or a friend, compared with 15%Footnote28 who started their mornings using cannabis on a daily basis. Similarly, 21% of those who were “stoned” or “high” for less than 1 hour on days that they used cannabis, accessed it when it was shared around friends. Finally, 24% of those who were “stoned” or “high” for less than 1 hour on days that they used cannabis, obtained cannabis from a family member or a friend, compared with 11% of those who were “stoned” or “high” for more than 7 hours Footnote28.
Chart 3: Hours “High” per Day and Sourcing Cannabis from a Dealer or Storefront Dispensary
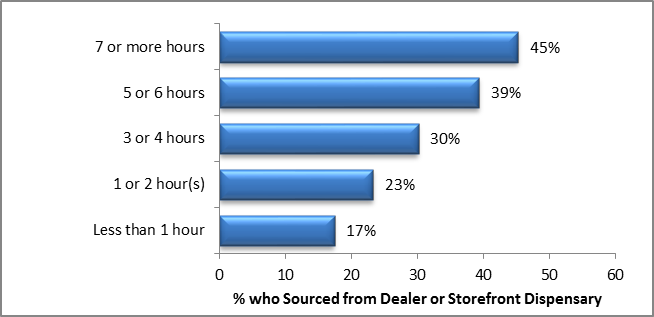
Image Description
Chart 3 is a bar chart describing the number of hours “high” per day and sourcing cannabis from a dealer or storefront dispensary. The y-axis represents the number of hours “high” per day, while the x-axis represents percentages.
From the top, the distribution of dealer or storefront dispensary source of cannabis is as follows: 45% of those who said they spend 7 or more hours “high” per day obtained their cannabis from a dealer or storefront dispensary; 39% of those who said they spend 5 to 6 hours “high” per day obtained their cannabis from a dealer or storefront dispensary; 30% of those who said they spend 3 to 4 hours “high” per day obtained their cannabis from a dealer or storefront dispensary; 23% of those who said they spend 1 to 2 hours “high” per day obtained their cannabis from a dealer or storefront dispensary; and 17% of those who said they spend less than 1 hour “high” per day obtained their cannabis from a dealer or storefront dispensary.
Source: 2017 Canadian Cannabis Survey
Those who bought or bartered their cannabis obtain it from an acquaintance or a dealer
Overall, 70% of those who used cannabis said they bought or bartered their cannabis, whereas 30% said they obtained it for free.Footnote29 Those who used cannabis who stated they bought their cannabis or bartered for it (as opposed to getting it for free)Footnote30 tended to source it from a dealer or a storefront dispensary (36%), an acquaintance (35%), or a family member or a friend (27%). Those who obtained the drug for free sourced it from a family member or a friend (63%), or an acquaintance (26%).
Those who resold or traded obtained non-medical cannabis, source it from a dealer, acquaintance or family member or friend
In the 12 months prior to the survey, 11% of those who used cannabis said they sold, resold or traded the cannabis they obtained to others.Footnote31 Among respondents who used cannabis who sold, resold, or traded the cannabis they obtained, tended to source cannabis from a dealer or storefront dispensary (33%), an acquaintance (24%), a family member or a friend (23%), and to a lesser extent when it was shared around a group of friends (13%).Footnote32 On the other hand, respondents who used cannabis who had not sold, resold, or traded cannabis they obtained, sourced it from a family member or a friend (27%), when it was shared around (26%), an acquaintance (23%), or from a dealer or storefront dispensary (18%).
Sources of cannabis differ by those who share cannabis
Sixty percent (60%) of those who used cannabis said they shared or gifted some of the cannabis they obtained for non-medical purposes with others by passing a joint, bong, or pipe around in a group. Respondents who used cannabis and who shared or gifted cannabis while consuming (i.e., passing a joint in a group)Footnote33 in the 12 months prior to the survey most often obtained their cannabis from a family member or a friend (26%), followed by those who obtained it from a dealer or a storefront dispensary (24%), an acquaintance and who obtained it by sharing around a group of friends (22% each).
One-third of respondents (33%) said they shared or gifted some of the cannabis they obtained for non-medical purposes with others, not including sharing while consuming (e.g., passing a joint/bong/pipe around in a group).Footnote34 The highest proportion of sources of cannabis when not sharing while consuming was from a dealer or storefront dispensary (28%), followed by an acquaintance (26%), family member or a friend (24%), and when it was shared around a group of friends (16%), which is a different pattern from that observed for those who shared while consuming.
Frequent users of cannabis before going to or while at school or work, source their cannabis from a dealerFootnote35
Approximately one in ten (11%) reported frequently or occasionally using cannabis for non-medical purposes to get stoned or high before going to, or while at, school, college, or university in the 12 months prior to the survey. Another 27% said they have done this infrequently; and 52% said they have not done this.
Frequent users who indicated using cannabis for non-medical purposes to get stoned or high before going to, or while at, school, college, or university, most often (52%) sourced their cannabis from a dealer or a storefront dispensary (Chart 4). This compares to 39%Footnote36 of those who said they occasionally used cannabis to get “high” before going to or while at school, 26% of those who used cannabis infrequently for the same purpose, and 16% of those who have not done this in the 12 months prior to the survey.
Overall, 6% of respondents who used cannabis said they have frequently used cannabis for non-medical purposes to get “high” before going to, or while at, work in the 12 months prior to the survey. Another 5% said they did this occasionally; 11% said they did this infrequently; and 79% said they have not done this.
Over one-third (37%) of those who said they used cannabis frequently to get “high” before going to or while at work sourced their cannabis from a dealer or a storefront dispensary. This compares to 43%Footnote36 of those who used cannabis occasionally, 27% who used cannabis infrequently, and 16% of those who have not done this in the 12 months prior to the survey.
Chart 4: Type of User by Frequency of Using Cannabis before going to or while at School or Work
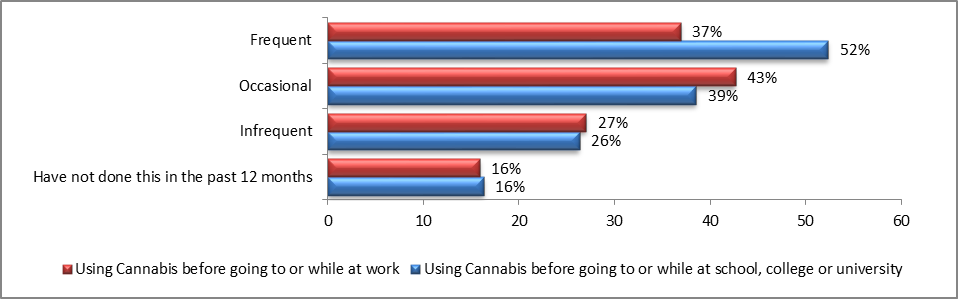
Image Description
Chart 4 is a bar chart describing the relationship between using cannabis before going to or while at school, college, university or work and sourcing cannabis from a dealer or storefront dispensary. The y-axis represents using cannabis before going to or while at school, college, university or work, while the x-axis represents percentages. Differently-coloured bars represent either using cannabis before going to or while at school, college or university, or using cannabis before going to or while at work.
From the top, 37% of respondents said they used cannabis frequently before going to or while at school, college or university; and 52% of respondents said they used cannabis frequently before going to or while at work. 43% of respondents said they used cannabis occasionally before going to or while at school, college or university; and 39% of respondents said they used cannabis occasionally before going to or while at work. 27% of respondents said they used cannabis infrequently before going to or while at school, college or university; and 26% of respondents said they used cannabis infrequently before going to or while at work. An equal percentage of respondents (16%) said they have not used cannabis before going to or while at school, college, university, or work.
Source: 2017 Canadian Cannabis Survey
Drug-Impaired Driving
Impaired driving, particularly by cannabis, is a subject of great concern especially with the recent legalization. Recently released police statistics indicate that the number of drug-impaired driving (DID) incidents continues to increase. In total, there were 3,489 DID violations in 2017, which is an increase of 353 incidents from the previous year (Allen, 2018). In Canada, more people are being killed annually in crashes related to DID than alcohol-impaired driving. In 2012, there were 614 road fatalities associated with the influence of drugs in the driver in contrast to 476 fatalities associated with alcohol in the driver (Solomon and Clarizio, 2016). While there has been an increase in instances of drugs in the driver’s body and roadside fatalities, the above reports cannot indicate how many of the roadside fatalities were caused by drug-impairment.
Undoubtedly, DID is an important and complex topic from a public safety perspective. Law enforcement has emphasized that impaired driving is a serious issue that currently exists and requires immediate action to protect public safety (McLellan et al., 2016). The new laws on drug-impaired driving through the new and strengthened impaired driving legislation will in part address some of the aforementioned concerns, by allowing police to use additional tools such as roadside oral fluid drug screeners. Further, the use of standardized field sobriety test (SFST) and drug recognition expert (DRE) evaluations will continue to be important tools used by law enforcement to enforce cannabis and other drug-impaired driving laws.
Results
The current demographic analysis begins with an examination of beliefs about DID, followed by analyses related to DID behaviours including driving within 2 hours of using cannabis, cannabis and alcohol, as well as cannabis and other drugs. Finally, consideration is given to those who have been passengers in a vehicle after another person has used cannabis. Tables 8-12 in the Annex contain all of the following results.
Beliefs about drug-impaired driving
All CCS respondents were asked a number of questions related to their beliefs about cannabis use for non-medical purposes and the impact on impairment to drive a vehicle, as well as when it is safe for someone to drive a vehicle after using cannabis for non-medical purposesFootnote37.
The majority of respondents (83%) agreed that using cannabis for non-medical purposes impairs a person’s ability to drive a vehicle, followed by 10% who indicated “it depends”. A small proportion (8%), disagreed that cannabis can impair a person’s ability to drive a vehicle.
When asked when it is safe for someone to drive a vehicle after using cannabis for non-medical purposes, nearly half of respondents (46%) indicated that it depends on each person, their weight as well as quantity and the method of consumption. A smaller proportion of respondents (16%) indicated 3 hours to just under 5 hours, followed by 12% who said 1 hour to just under 3 hours and 11% who said more than 8 hours after.
Men more than women believe it is safe to drive immediately after using cannabis (4% versus 3%). Women (85%) more often than men (80%) believed that use of non-medical cannabis impairs driving.
Younger respondents do not believe non-medical cannabis impairs driving
There was a significant association between age and beliefs that using cannabis for non-medical purposes impairs one’s ability to drive or operate a vehicle. The smallest proportion of those who believe that use of non-medical cannabis impairs driving was for those aged 16 to 19 and 20 to 24 (both 69%), suggesting that younger respondents do not believe non-medical cannabis impairs driving. Canadians 55 years of age or older (89%) were the group most often to report that use of non-medical cannabis impairs driving (Chart 5).
Quebec had the highest proportion of respondents who believe cannabis impairs driving
The results suggest there is a significant relationship between region and beliefs about the impacts of non-medical cannabis on driving. In particular, Quebec had the largest proportion of respondents who believed that non-medical cannabis impairs the ability to drive (87%), while those living in the Atlantic region had the smallest proportion (79%).
Chart 5: Beliefs about the impacts of non-medical cannabis on driving by age category
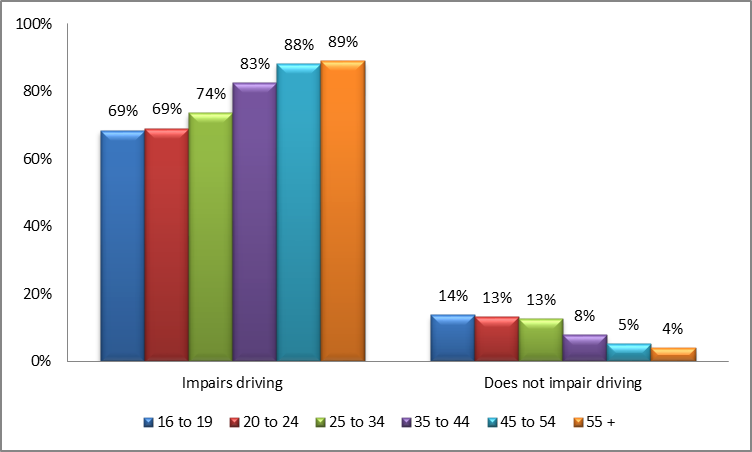
Image Description
Chart 5 is a bar chart describing the beliefs about the impacts of non-medical cannabis on driving by age category. The y-axis represents percentages, while the x-axis represents the beliefs. Differently-coloured bars represent different age categories.
The first set of bars represents the belief that non-medical cannabis impairs the ability to drive. From the left-hand side, the distribution of the age categories who said they believe this is as follows: 69% of those who are 16-19 years old; 69% of those who are 20-24 years old; 74% of those who are 25-34 years old; 83% of those who are 35-44 years old; 88% of those who are 45-54 years old; and 79% of those who are 55 years of age and older.
The second set of bars represents the belief that non-medical cannabis does not impair the ability to drive. From the left-hand side, the distribution of the age categories who said they believe this is as follows: 14% of those who are 16-19 years old; 13% of those who are 20-24 years old; 13% of those who are 25-34 years old; 8% of those who are 35-44 years old; 5% of those who are 45-54 years old; and 4% of those who are 55 years of age and older.
Source: 2017 Canadian Cannabis Survey
Frequent cannabis users are less likely to agree that using cannabis impairs driving
There was a significant association between user type and beliefs about non-medical cannabis and its ability to impair driving. Infrequent users most often believed that cannabis use impairs driving (75%), followed by occasional and frequent (50% and 31% respectively).
There was also a significant association between user type and opinions about when a person could drive a vehicle after using non-medical cannabis. Frequent users, followed by both occasional and infrequent users indicated it is safe to drive immediately after using non-medical cannabis (12% compared with 4% and 2% respectively), which is consistent with the above findings wherein frequent users do not necessarily believe that cannabis impairs driving.
Nearly one-quarter of those who believe cannabis impairs driving, nonetheless choose to drive within 2 hours of using cannabisFootnote38
Those who did not believe that using cannabis for non-medical purposes impairs the ability to drive a vehicle were the group most often to have driven a motor vehicle within 2 hours of using cannabis (64%), followed by 56% who indicated ‘it depends’ (Chart 6). Interestingly, although 22% agreed that cannabis impairs driving, respondents nonetheless drove a motor vehicle within 2 hours of using cannabis.
Those who did not believe that using cannabis for non-medical purposes impairs the ability to drive a vehicle and those who reported ‘it depends’ were the groups most often to report having been a passenger with someone who used non-medical cannabis within 2 hours of driving (82% and 81% respectively). Further, nearly one-third of those who agreed that cannabis impairs driving (31%), were passengers in a vehicle driven by someone who used cannabis.
Chart 6: Beliefs about the impacts of non-medical cannabis on driving by those reporting having driven within 2 hours of using cannabis
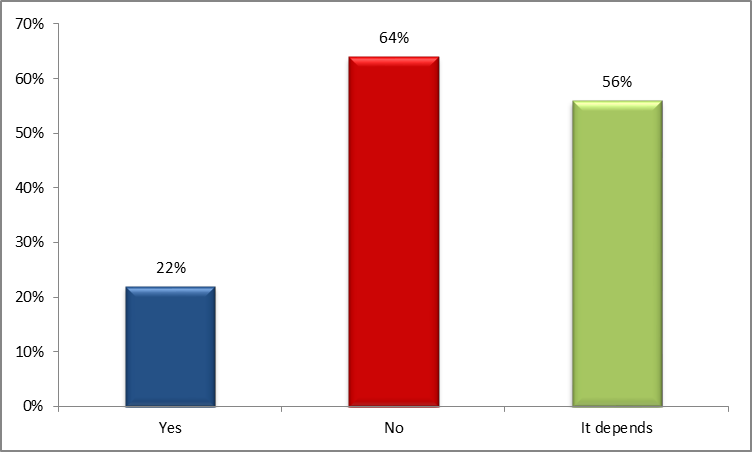
Image Description
Chart 6 is a bar chart describing the relationship between the beliefs about the impacts of non-medical cannabis on driving and those reporting having driven within 2 hours of using cannabis. The y-axis represents percentages, while the x-axis represents the behaviours.
From the left-hand side, 22% of those who said they believed non-medical cannabis impair the ability to drive, said they drove a motor vehicle within 2 hours of using cannabis; 64% of those who said they believed non-medical cannabis does not impair the ability to drive, said they drove a motor vehicle within 2 hours of using cannabis; and 56% of those who said “it depends,” said they drove a motor vehicle within 2 hours of using cannabis.
Source: 2017 Canadian Cannabis Survey
Behaviours related to drug-impaired driving
Driving within 2 hours of using cannabis
Respondents were asked whether they had driven a motor vehicle (e.g. car, snowmobile, motor boat or all-terrain vehicle (ATV) within 2 hours of using cannabis for non-medical purposes. Results show that 39% of respondents who used cannabis reported driving within 2 hours of using cannabis; among this group, 40% reported having last driven in the 30 days prior to the survey and 28% reported having last done this within the 12 months prior to the survey.Footnote39
Men more often report having driven within 2 hours after using cannabis
Results show significant differences for gender. In particular, 45% of men and 31% of women indicated they had driven a motor vehicle within 2 hours of using non-medical cannabis.
Driving a vehicle within 2 hours of using cannabis differs by age
Those between the ages of 25 to 34 (45%), followed by those aged 20 to 24 (43%), 35 to 44 (43%) and 45 to 54 (38%) most often reported having driven a motor vehicle within 2 hours of using non-medical cannabis (Chart 7). A smaller proportion of those who used cannabis aged 16 to 19 (28%), and 55+ (30%) indicated having driven a motor vehicle within 2 hours of using non-medical cannabis.
Chart 7: Driven within 2 hours of using non-medical cannabis by age category
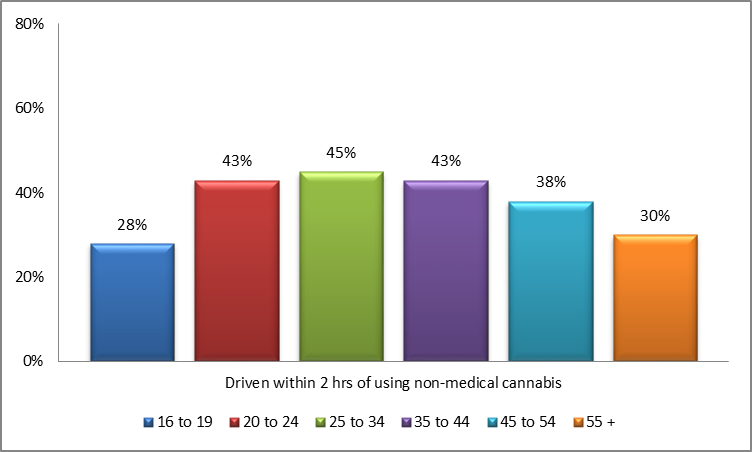
Image Description
Chart 7 is a bar chart describing driving within 2 hours of using non-medical cannabis by age category. The y-axis represents percentages, while the x-axis represents the beliefs. Differently-coloured bars represent different age categories.
From the left-hand side, the distribution of the age categories who reported having driven a motor vehicle within 2 hours of using non-medical cannabis is as follows: 28% of those who are 16-19 years old; 43% of those who are 20-24 years old; 45% of those who are 25-34 years old; 43% of those who are 35-44 years old; 38% of those who are 45-54 years old; and 30% of those who are 55 years of age and older.
Source: 2017 Canadian Cannabis Survey
Drivers in Western and Atlantic Canada had the highest proportion of those who reported driving after using cannabis
Responses differed by region to a statistically significant degree. Western Canada had the highest proportion of drivers who indicated having used cannabis within 2 hours of driving (46%), followed by those in Atlantic Canada (42%). Respondents in Ontario and Quebec were those with the lowest proportion of drivers who indicated having used cannabis within 2 hours of driving (34% and 36% respectively).
Frequent cannabis users most often drive within 2 hours of using cannabis
The results also suggest there is a significant relationship between frequency of use and having driven within 2 hours of using non-medical cannabis. More specifically, frequent users (60%) compared with occasional and infrequent cannabis users (42% and 21% respectively), reported having driven a motor vehicle within 2 hours of using non-medical cannabis (Chart 8).
Chart 8: Driven within 2 hours of using non-medical cannabis by type of user
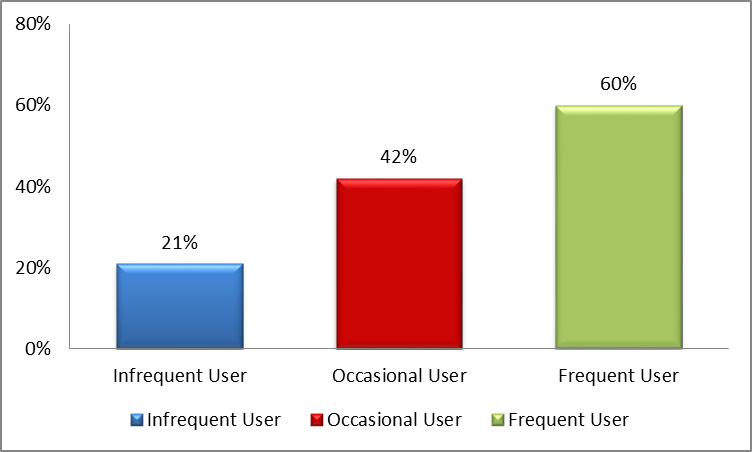
Image Description
Chart 8 is a bar chart describing driving within 2 hours of using non-medical cannabis by type of user. The y-axis represents percentages, while the x-axis represents the type of users.
From the left-hand side, the percentages for those who reported having driven a motor vehicle within 2 hours of using non-medical cannabis is as follows: 21% of infrequent users; 42% of occasional users; and 60% of frequent users.
Source: 2017 Canadian Cannabis Survey
Driving within 2 hours of using cannabis and alcohol
Respondents who had reported driving within 2 hours of using cannabis were asked if they had driven a vehicle within 2 hours of using cannabis with alcohol. Overall, 15% reported driving after using cannabis and alcohol.Footnote40
Infrequent cannabis users reported driving within 2 hours of using cannabis with alcohol
According to the results of the 2017 CCS, there was a significant association between user type and driving within 2 hours of using cannabis with alcohol. Interestingly, the most infrequent users of cannabis (30%) reported having driven within 2 hours of using cannabis with alcohol more often than either occasional (12%)Footnote41 or frequent users (11%).
Driving within 2 hours of using cannabis and other drugsFootnote42
Respondents who had reported driving within 2 hours of using cannabis were also asked if they had driven a vehicle within 2 hours of using non-medical cannabis with another drug.Footnote43 A small proportion (8%) indicated they had done so.
Men more often than women drove within two hours of using cannabis and another drug
The results suggest there is a significant relationship between gender and having driven within 2 hours of using cannabis and other drugs. Specifically, men (9%) more than women (5%)Footnote44 indicated they had driven a vehicle within 2 hours of using non-medical cannabis with another drug.
Passenger in a car driven by someone who used non-medical cannabis
According to the results of the 2017 CCS, 39% of Canadians reported having been a passenger in a vehicle driven by someone who used non-medical cannabis within 2 hours. These results are similar to those from the 2017 study on drug-impaired driving that found 33% of respondents reported being a passenger in a vehicle operated by a driver who was under the effects of cannabis (EKOS, 2017)Footnote45.
Men more often report being a passenger with someone who used cannabis
According to the results of the 2017 CCS, there was a significant association between gender and being a passenger in a vehicle driven by someone who used non-medical cannabis within 2 hours. Men (44%) more than women (34%) reported having been a passenger.
Younger respondents more often report being a passenger in a vehicle driven by someone who used cannabis
When responding whether they had been a passenger in a vehicle driven by someone who used non-medical cannabis within 2 hours, there was a statistically significant difference between age categories. In particular, those aged 25 to 34 (58%) and 20 to 24 (56%) most often reported to have been a passenger (Chart 9). In contrast, those 55 years and older (28%) were the least likely to have been a passenger.
Chart 9: Passenger in a vehicle driven by someone who used non-medical cannabis within 2 hours by age category
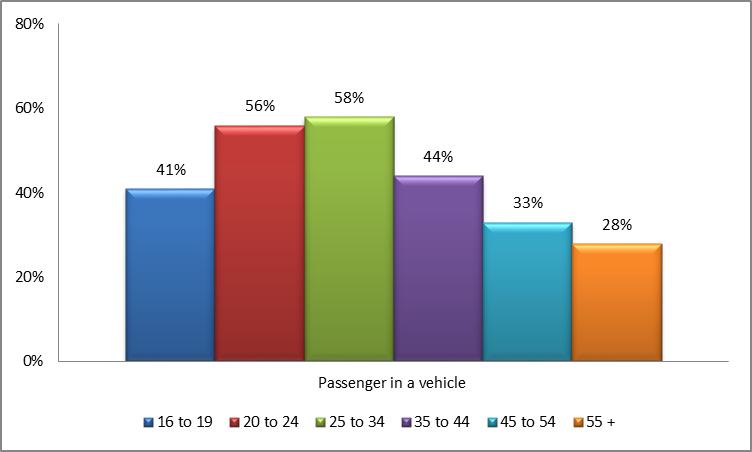
Image Description
Chart 9 is a bar chart describing being a passenger in a vehicle driven by someone who used non-medical cannabis within 2 hours by age category. Differently-coloured bars represent different age categories.
From the left-hand side, the distribution of the age categories who reported being a passenger in a vehicle driven by someone who used non-medical cannabis within 2 hours is as follows: 41% of those who are 16-19 years old; 56% of those who are 20-24 years old; 58% of those who are 25-34 years old; 44% of those who are 35-44 years old; 33% of those who are 45-54 years old; and 28% of those who are 55 years of age and older.
Source: 2017 Canadian Cannabis Survey
Being a passenger in a vehicle driven by someone who used cannabis differs by region
As observed with cannabis use and driving, the results from the 2017 CCS show that those in Atlantic Canada had the highest proportion of respondents reporting being a passenger in a vehicle driven by someone who used non-medical cannabis within 2 hours (47%), followed by those in Western Canada (44%). Quebec had the smallest proportion of respondents (34%) who reported having been a passenger, followed by those living in Ontario (37%).
The vast majority of frequent cannabis users report being a passenger with someone who used cannabis within 2 hours of driving
There was a significant association between user type and being a passenger in a vehicle driven by someone who used non-medical cannabis within 2 hours. Frequent users (92%), followed by occasional users (82%) and infrequent users (65%) reported having been a passenger.
Interactions with Law Enforcement
In 2017, there were approximately 48,000 drug offences reported by police, of which the majority (80%) were incidents of cannabis possession (Allen, 2018). With cannabis legalization, there may be a reduction of the burdens on both police and the justice system relating to simple possession of cannabis offences for adults, while still making it an offence for youth to possess cannabis.
Results
Based on results from the 2017 CCS, only 2% of those who used cannabis in the 12 months prior to the survey reported having had interactions with police for their possession of non-medical cannabis in the 12 months prior to the survey.Footnote46 Below are the analyses of those who used cannabis for non-medical purposes who have had interactions with police related to their non-medical possession of cannabis. The analysis considers only demographic information that was provided during the 2017 CCS.Footnote47
Table 13 in the Annex contains all of the following results.
Gender
Among those who indicated they had interactions with police for their non-medical possession of cannabis, more men reported having these interactions in the past 12 months (85%).
Age
The results suggest that those who used cannabis aged 25 to 34 (30%), 16 to 19 (29%) and 20 to 24 (25%) most commonly reported having contact with police for their non-medical possession of cannabis.Footnote48 No respondents over the age of 55 indicated having had contact with police for their non-medical cannabis.
Region
Over one-third of those who used cannabis who had contact with police for their non-medical cannabis (39%), lived in Ontario, followed by 36% who lived in Western CanadaFootnote48. Among those who used cannabis who reported having contact with police, 18% lived in Quebec and 7% reported living in the Atlantic regionFootnote48.
Type of User
When considering user characteristics (i.e., infrequent user, occasional user and frequent users), among those who reported having had interactions with police for possession of non-medical cannabis, the majority (71%) were frequent users.
Price of Cannabis and Quantity Consumed Footnote49
Having solid estimates of price and quantity of cannabis consumed in Canada before the legalization will aid policy makers in at least two ways. First, estimating the price of cannabis from a variety of sources will assist in better setting and correcting the price for legal cannabis. Setting the price of legal cannabis too low could make the product attractive and accessible to youth, whereas too high of a price will contribute to a flourishing black market and organized crime involvement. Second, estimating the quantity of cannabis consumed will inform the policy on expected consumption patterns of legal cannabis.
Results
On average, respondents who indicated they used cannabis in the 12 months prior to the survey typically spent $75.79 each month for non-medical cannabis.Footnote50 Further, respondents who indicated they used cannabis in the 30 days prior to the survey spent on average $89.88 for non-medical cannabis in the same time period.Footnote51
Those who indicated they used dried/leaf cannabis in the 30 days prior to the survey,Footnote52 typically bought or received on average 12.57 grams of non-medical dry/leaf cannabis each time they completed a transaction.Footnote53 Respondents spent an average of $78.64 during each transaction.Footnote54 The average price per gram of dried/leaf cannabis that those who used cannabis paid in their typical transactionFootnote55 is estimated to be $11.40.Footnote56 This price estimate is noticeably higher when compared with previous findings. A recent study by the Parliamentary Budget Officer (PBO, 2016) estimated the price of illicit cannabis to be between $8.32 and $9.36 in 2015-2016, with a mid-point estimate to be at $8.84 per gram. Boucher, Lawrence and Maslov (2013) found the average price of cannabis in Canada to be slightly lower at $7.54 in 2011-2012. Ouellet et al. (2016) found the price of perceived high quality cannabis to be at $7.69 per gram, followed by perceived low quality at $7.26; and perceived medium quality cannabis at $7.14. The lower average prices reported in Boucher et al. (2013) and Ouellet et al. (2016) are based on self-reported data downloaded from priceofweed.com. Finally, Statistics Canada launched their own crowdsourcing initiative to collect information on cannabis prices in Canada in early 2018. They estimated the price of cannabis to be at $6.78 for the first quarter of 2018 (Statistics Canada, 2018).
Very few studies or surveys collected data on the volume or quantity of cannabis that is consumed by the users. The CCS 2017 is one of the very few attempts to do so. In terms of daily consumption, overall respondents consumed an average of 0.90 grams of dried/leaf non-medical cannabis per day.Footnote57
Tables 14-15 in the Annex contain all of the following results, including results for F-value tests.
Men pay less per gram for non-medical cannabis and used a larger quantity than did women
Among all of the demographic and socio-economic variables that were available in the survey, only the gender of the respondent was found to be a significant predictor of both the price paid for non-medical cannabis and the average daily quantity of cannabis consumed. Men tended to pay less per gram for non-medical cannabis ($10.01) and used a larger quantity per day (0.98 gram/day) than did women ($14.11 and 0.79 gram/day, respectively).
Respondents in Quebec and Atlantic Canada pay less per gram
Respondents in Quebec ($8.11) and Atlantic Canada ($9.78) on average paid considerably smaller amounts of money per gram of cannabis than did respondents in Western provinces ($12.08) or Ontario ($12.48).
Those who used cannabis frequently pay less and use more on averageFootnote58
The 2017 CCS results show a significant relationship between the frequency of using cannabis and the amount consumed on a daily basis. Frequent users consumed on average 1.55 grams of dried/leaf cannabis per day and paid $8.77 per gram of their cannabis. This compares to 0.68 grams consumed and $12.15 per gram of dried/leaf cannabis paid by occasional users, and 0.49 grams consumed and $21.89 per gram paid by infrequent users.
Overall, there was a moderate, positive and statistically significant correlation between the number of times cannabis was used per day and the amount of cannabis that was used per day. An increase in the number of times cannabis is used was positively correlated with the increase in the amount of cannabis consumed.
Earlier age of initiation affects the quantity of cannabis consumed
One of the cornerstone objectives of the legislation on the recreational use of cannabis is restricting access to cannabis by children and youth. Analysis of the current data show that there was a significant correlation between the age at which respondents tried or started using cannabis for the first timeFootnote59 and the quantity of cannabis that they consume on a daily basis. The results show that the earlier the age at which someone tried or started using cannabis for the first time (i.e., the age of initiation of use), the higher the quantity of cannabis they are likely to report consuming on a daily basis.
The correlation between age of initiation of cannabis use and the price of cannabis that those who used cannabis paid is not statistically significant.
Some problematic use of cannabis affects the quantity of cannabis consumed
There is a volume of literature that addresses the issue of problematic use of substances such as tobacco, drugs and alcohol. However, very few studies examined the association between problematic use and the quantity of cannabis that is consumed, most likely because of the difficulty of measuring volumes of cannabis consumed. Asbridge et al. (2014) argued that there might be a connection, albeit identifying problematic use is, in itself, a challenging task. Temple et al. (2011) supported the argument in that because of the various limitations in literature, which includes lack of measurement of quantity of cannabis used, we cannot fully comprehend the problematic experiences of those who use cannabis.
Analysis of 2017 CCS data shows that there is a linear and statistically significant association between some examples of problematic use of non-medical cannabis, and the amount of cannabis consumed on a daily basis. The average amount of cannabis used daily steadily increases as does the number of mornings that are started by using cannabis.Footnote60 The proportional distribution of the given variable was discussed earlier in the report.
Regarding the quantity of cannabis consumed, those who did not report starting any mornings by using cannabis in the 30 days prior to the survey consumed an average of 0.68 grams of cannabis per day, while those who reported starting one morning by using cannabis used 1.11 grams of cannabis per day (Chart 10). The average amount of daily use of cannabis almost doubles (2.22 grams per day) for those who reported starting their morning using cannabis 5 to 6 days per week, and more than doubles (2.65 grams per day) for those who reported starting mornings using cannabis daily.
Further, the number or hours per day that those who used cannabis reported being stonedFootnote61 was associated with the average daily consumption of cannabis. Those who reported being stoned for less than 1 hour per day, on average, used 0.94 grams of non-medical cannabis per day. This compares to a considerably larger amount of average daily consumption of non-medical cannabis (1.37 grams per day) for those who reported being stoned 5 or 6 hours per day, and a more than double amount of average daily consumption of non-medical cannabis (2.47 grams per day) for those who reported being stoned 7 or more hours per day.
There is no statistically significant association between the above examples of problematic use of cannabis and the average price of cannabis that those who used cannabis reported paying.
Chart 10: Examples of Problematic Use of Cannabis and Average Daily Consumption
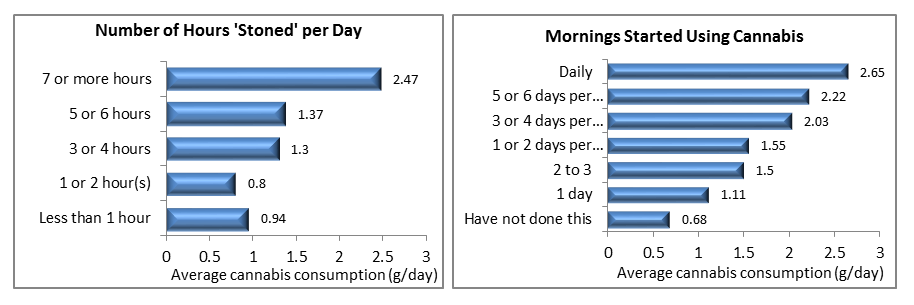
Image Description
Chart 10 displays two side-by-side bar charts, both describing the relationship between examples of problematic use of cannabis and average daily consumption of non-medical cannabis. The left-hand bar chart represents the relationship between the number of hours “stoned” per day and the average amount of cannabis consumed per day. From the top down, the distribution is as follows: those who spent 7 hours or more “stoned” per day consumed on average 2.47 grams of cannabis per day; those who spent 5 or 6 hours “stoned” per day consumed on average 1.37 grams of cannabis per day; those who spent 3 or 4 hours “stoned” per day consumed on average 1.3 grams of cannabis per day; those who spent 1 or 2 hours “stoned” per day consumed on average 0.8 grams of cannabis per day; and those who spent less than 1 hour “stoned” per day consumed on average 0.94 grams of cannabis per day.
The right-hand bar chart represents the relationship between the number of days which the respondent started by using cannabis in the morning and the average amount of cannabis consumed per day. From the top down, the distribution is as follows: those who started their mornings by using cannabis daily consumed on average 2.65 grams of cannabis per day; those who reported starting their morning using cannabis 5 to 6 days per week consumed on average 2.22 grams of cannabis per day; those who reported starting their morning using cannabis 3 to 4 days per week consumed on average 2.03 grams of cannabis per day; those who reported starting their morning using cannabis 1 to 2 days per week consumed on average 1.55 grams of cannabis per day; those who reported starting their morning using cannabis 2 to 3 days per month consumed on average 1.5 grams of cannabis per day; those who reported starting their morning using cannabis 1 day per month or less consumed on average 1.11 grams of cannabis per day; and those who have not started any mornings using cannabis consumed on average 0.68 grams of cannabis per day.
Source: 2017 Canadian Cannabis Survey
Source(s) of cannabis is related to the daily quantity of cannabis consumed
The number and type of sources from where those who used cannabis obtained their non-medical cannabis,Footnote62 as well as whether they purchased or obtained the substance for free, all affect the daily average consumption of the drug. Those who said they grew all their cannabis themselves, on average, consumed 0.94 grams of non-medical cannabis per day. Other than growing cannabis for themselves, the number of sources from which those who used cannabis obtained their cannabis tended to affect the amount of cannabis they consumed. Those who used cannabis who obtained it from one source consumed the lowest average daily amount of cannabis among all other respondents (0.74 grams/day). Interestingly, the average daily consumption tends to increase with the number of sources of cannabis. For example, those who used cannabis who had 2 or 3 sources of cannabis consumed almost a full gram (0.99) of cannabis per day, whereas those who had 4 or 5 sources and 6 or more sources tended to consume considerably more (1.35 and 1.62 grams per day respectively).
The source of non-medical cannabis itself is an important contributor to the average daily amount of cannabis that is consumed.Footnote63 By far, those who used cannabis whose main source was growing the drug themselves, tended to be the heaviest consumers of the substance, with daily consumption averaging at 2.79 grams per day. The next biggest consumers are those who obtained their cannabis from a storefront dispensary or a dealer (1.33 g/day), followed by those who obtained cannabis from a Health Canada licensed producer by mail order (1.08 g/day), an acquaintance (0.91 g/day), or for whom cannabis was grown (0.89 g/day). The two groups who consumed the least daily average amounts of cannabis are those who obtained their cannabis from a family member or a friend (0.79 g/day) and those who shared cannabis among friends (0.61 g/day), likely reflecting the culture of occasional usage and sharing cannabis joints among friends at events or parties.
Those who purchased or bartered non-medical cannabis tended to consume more than a double average daily amount of the substance when compared with those who obtained the cannabis for free (1.16 vs. 0.54 g/day).
Respondents who purchased or received cannabis more frequently, also reported higher average amounts of daily cannabis consumption. As such, those who purchased or received dried/leaf cannabis one day per month reported consuming 0.64 grams of dried/leaf cannabis per day. This compares to over double (1.99 g/day) average amount of daily consumption reported by respondents who purchased or received cannabis 1 to 2 days per week; more than quadruple (2.52 g/day) amount of average daily consumption reported by those who purchased or received cannabis 5 to 6 days per week; and over six times higher amount (3.93 g/day) among those who reported purchasing or receiving dried/leaf cannabis daily.
There is a statistically significant association between the price of non-medical cannabis that was paid for the substance and the source of the substance. Those for whom cannabis was grown ($14.08 per gram); who obtained their non-medical cannabis from an acquaintance ($13.37 per gram); those who accessed cannabis when it was shared around in a group of friends ($13.31 per gram); and those who grew their own cannabis ($10.75 per gram) reported paying the highest average price for their cannabis. This compares to those who obtained cannabis from a dealer or storefront dispensary ($9.69 per gram); from a family member or a friend ($9.66 per gram); and those obtained cannabis from a Health Canada licensed producer by mail order ($8.24) who, on average, reported paying smaller amounts of money for their cannabis.
Frequency of cannabis use before going to, or while at school or work affects the amount of cannabis consumed
The average amount of daily consumption of non-medical cannabis tends to increase with the frequency of cannabis use to get “stoned” before going to, or while at school, college, or university, or work.Footnote64 Those who said they used cannabis frequently (2.08 grams per day) or occasionally (1.68 grams per day) before going to or while at school, college or university reported consuming noticeably higher average amounts of cannabis per day than did those who said they never consumed cannabis before going to, or while at school, college or university, or those who reported having done so infrequently (0.53 and 0.86 grams per day, respectively) (Chart 11).
A similar picture emerges when it comes to those who used cannabis to “get stoned” before going to, or while at work. As is the case with those who used before or while at school, those who reported using cannabis frequently (2.37 grams per day) or occasionally (1.74 grams per day) before going to or while at work also reported consuming noticeably higher average amounts of cannabis per day than did those who said they never consumed cannabis before going to or while at work, or those who said they have done so infrequently (0.72 and 1.10 grams per day, respectively).
There is no statistically significant association between the price those who used cannabis paid for non-medical cannabis and the frequency of use before going to or while at school, college, university, or work.
Chart 11: Using Cannabis before going to or while at School, College, University or Work and Average Daily Consumption
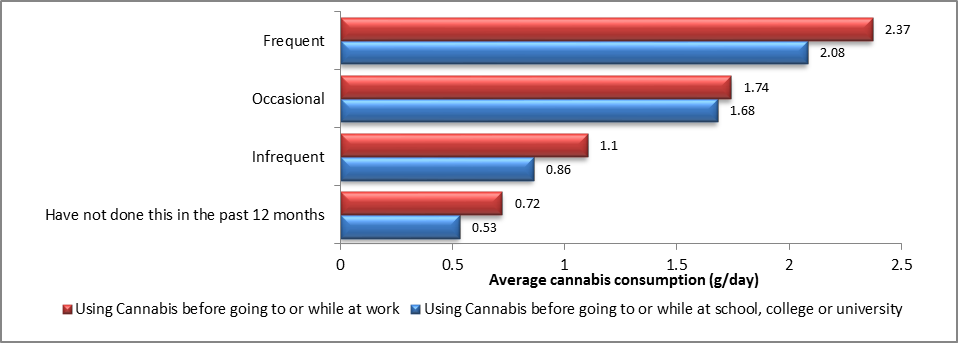
Image Description
Chart 11 is a bar chart describing the relationship between using cannabis before going to or while at school, college, university or work and the average amount of cannabis consumed per day. The y-axis represents using cannabis before going to or while at school, college, university or work, while the x-axis represents the average amount of cannabis consumed per day. Differently-coloured bars represent either using cannabis before going to or while at school, college or university, or using cannabis before going to or while at work.
From the top, respondents who said they used cannabis frequently before going to or while at work consumed on average 2.37 grams of cannabis per day; and respondents who said they used cannabis frequently before going to or while at school, college or university consumed on average 2.08 grams of cannabis per day. Respondents who said they used cannabis occasionally before going to or while at work consumed on average 1.74 grams of cannabis per day; and respondents who said they used cannabis occasionally before going to or while at school, college or university consumed on average 1.68 grams of cannabis per day. Respondents who said they used cannabis infrequently before going to or while at work consumed on average 1.1 grams of cannabis per day; and respondents who said they used cannabis infrequently before going to or while at school, college or university consumed on average 0.86 grams of cannabis per day. Finally, respondents who said they have not used cannabis before going to or while at work consumed on average 0.72 grams of cannabis per day; and respondents who said they have not used cannabis before going to or while at school, college or university consumed on average 0.53 grams of cannabis per day.
Source: 2017 Canadian Cannabis Survey
Conclusion
The importance of understanding the behaviours and beliefs of those who use cannabis from a public safety perspective has been highlighted throughout this report. It is critical to understand the current perceptions and behaviours of those who use cannabis, as well as the possible behavioural and opinion changes after legalization, as it will help to develop public safety policy and program initiatives, including education and crime prevention activities. These aforementioned initiatives will ensure the main policy objectives of legalization, whether it is to reduce the involvement of organized crime in the cannabis industry or keep cannabis out of the hands of children and youth, are upheld.
Ongoing data and research will be needed to continue monitoring cannabis use and other public safety metrics following legalization. Public Safety Canada will continue to work in partnership with its federal partners to sustain appropriate data collection that examines driving habits after cannabis use, interaction with law enforcement because of cannabis possession, sources of cannabis, methods of consumption, price for cannabis, as well as new areas of interest that will arise with legalization.
Methodology and Limitations
The CCS was designed by federal government partners and external experts with an aim to collect detailed information on cannabis use in Canada that previous surveys failed to collect. Several concepts, such as methods of consumption of cannabis; quantity of cannabis consumed; cannabis-related contact with the police; or sources from which those who used cannabis obtained their cannabis are measured for the first time in Canada. The survey collected data from March 13, 2017 to May 24, 2017. In total, 9,215 respondents aged 16 years and older across all provinces and territories responded to the online survey. The sample included responses from 2,650 people who said that they had used cannabis in the 12 months prior to the survey for either non-medical or medical purposes.
The sample of CCS was designed using a two-stage sampling strategy. In the first stage, respondents were randomly recruited by phone. If a respondent passed a set of screening questions, a link to an online survey was forwarded to them. In the second stage, respondents were asked more specific questions, such as whether they used cannabis for either medical or non-medical purposes in the 12 months prior to the survey. If answered positively, they were encouraged to answer a separate list of questions containing details on their cannabis usage trends.
Certain quotas for sub-populations (e.g., people who used cannabis in the 12 months preceding the survey) were determined and met during the sampling procedure in order to ensure statistical relevance of results and representativeness of the sample of the population from which it is derived. Survey findings and results presented in this report were weighted by region, age groups, and gender. The percentages presented in the text are weighted and cannot be replicated by dividing the raw numbers from the tables in the annex by the total number of respondents. Unweighted (raw) numbers are provided in the tables at the end of each section of the paper.
Coefficients of Variation (CV) were examined for all of univariate and bivariate parameter estimates presented in the paper. A CV is a measure of the sampling variability or precision of an estimate within a given sample; although some degree of variability is always expected, too much variability could lead to unreliable estimates (e.g., of means, proportions, and regression coefficients). The table below summarizes the rules that were applied to the CVs computed for the estimates obtained from the current sample, in terms of the cut-off thresholds for what was considered to be sufficiently reliable vs. too unreliable to report:
| CV range | Estimate Stability |
|---|---|
0 – 16.5 |
Acceptable, the estimate stable |
16.6 – 33.3 |
Marginal, the estimate has moderate sampling variability and should be interpreted with caution |
>33.3 |
Unacceptable, the estimate is unstable and should be suppressed |
*CV= (standard error / coefficient) * 100 where the coefficient is either the regression coefficient or the proportion estimate.
Caution must be exercised when interpreting the results. The weights applied to the findings do not correct for any potential participation bias that may have been introduced to the sample as a result of the potential respondents knowing the subject of the survey (i.e., cannabis). In other words, there may be a participation bias as potential respondents were made aware of the topic of the survey before agreeing to participate. This may lead to those who use cannabis being more likely to complete a survey on cannabis than those who do not use cannabis. This and other methodological differences help to explain differences in prevalence of cannabis use estimates from this survey and other general population surveys such as the Canadian Tobacco, Alcohol, and Drug Survey (CTADS). The findings discussed in this report can be inferred to the general Canadian population based on gender, region, and age group, except for the findings in the sections that used unweighted data.
References
Allen, M. (2018). Police-Reported Crime Statistics in Canada, 2017. Statistics Canada, Catalogue no. 85-002-X. Retrieved from https://www150.statcan.gc.ca/n1/pub/85-002-x/2018001/article/54974-eng.htm, on October 4, 2018.
Asbridge, M., Duff, C., Marsh, D. C., & Erickson, P. G. (2014). Problems with the Identification of ‘Problematic' Cannabis Use: Examining the Issues of Frequency, Quantity, and Drug Use Environment. European Addiction Research, 20: 254-267.
Boucher, A., Lawrence, A., & Maslov, A. (2013). The price of marijuana in Canada: Preliminary discussion of using price data for operational and policy purposes. Ottawa, ON: Public Safety Canada.
Canadian Centre on Substance Use and Addiction (CCSA). (2018). Summary of Provincial and Territorial Cannabis Regulations (current to September 6, 2018). Retrieved from http://www.ccsa.ca/Resource%20Library/CCSA-Canadian-Provincial-Territorial-Cannabis-Regulations-Summary-2018-en.pdf on September 18, 2018.
EKOS Research Associates Inc. (2017). Public Opinion Research on Drug-Impaired Driving. Retrieved from http://epe.lac-bac.gc.ca/100/200/301/pwgsc-tpsgc/por-f/public_safety_canada/2018/019-17-e/index.htmlon September 18, 2018.
Maslov, A., Lawrence, A., & Ferguson, F. (2016). Cannabis performance metrics for policy consideration: What do we need to measure? Ottawa, ON: Public Safety Canada.
McLellan, A. A., Ware, M. A., Boyd, S., Chow, G., Jesso, M., Kendall, P., Souccar, R., von Tigerstrom, B., & Zahn, C. (2016). A framework for the legalization and regulation of cannabis in Canada: The final report of the task force on cannabis legalization and regulation. Ottawa, ON: Health Canada.
Ouellet, M., Macdonald, M., Bouchard, M., Morselli, C., and Frank, R. (2017). The Price of Cannabis in Canada. Ottawa, ON: Public Safety Canada.
Parliamentary Budget Officer (PBO). (2016, November 1). Legalized cannabis: Fiscal considerations. Retrieved from http://www.pbo-dpb.gc.ca/en/blog/news/Legalized_Cannabis
Perreault, S. (2016). Impaired Driving in Canada, 2015. Juristat Report 85-002-X. Ottawa, ON: Statistics Canada.
Statistics Canada. (2018). StatsCannabis data availability: Crowdsourced cannabis prices, March 2018. Catalogue no. 11-001-X. Retrieved from https://www150.statcan.gc.ca/n1/daily-quotidien/180413/dq180413c-eng.htm on July 25, 2018.
Temple, E. C., Brown, R. F. and Hine, D. W. (2011). The ‘grass ceiling’: limitations in the literature hinder our understanding of cannabis use and its consequences. Addiction, 106: 238-244.
Annex A
| Demographic and Other Characteristics | Method of consumption- smoking |
χ2 |
P |
|
|---|---|---|---|---|
n* |
% |
|||
Gender |
||||
Male |
1360 |
95.7 |
7.003 |
0.000 |
Female |
886 |
91.4 |
||
Age |
||||
16-19 |
239 |
97.3 |
30.476 |
0.000 |
20-24 |
477 |
97.9 |
||
25-34 |
737 |
93.4 |
||
35-44 |
380 |
93.6 |
||
45-54 |
238 |
96.5 |
||
55+ |
186 |
87.9 |
||
Region |
||||
West |
587 |
91.6 |
16.158 |
0.001 |
Ontario |
556 |
93.9 |
||
Quebec |
589 |
97.9 |
||
Atlantic |
525 |
94.4 |
||
Type of User |
||||
Infrequent |
885 |
90.1 |
44.706 |
0.000 |
Occasional |
551 |
94.0 |
||
Frequent |
821 |
98.7 |
||
Frequency of use to get stoned before going to/at school/college/university (12 months) |
||||
Infrequent |
138 |
94.1 |
5.433 |
0.143 |
Occasional |
59 |
100 |
||
Frequent |
54 |
100 |
||
Frequency of use to get stoned before going to/at work (12 months) |
||||
Infrequent |
253 |
93.8 |
7.080 |
0.069 |
Occasional |
113 |
99.8 |
||
Frequent |
136 |
96.7 |
||
Source: 2017 Canadian Cannabis Survey
*All sample sizes refer to non-weighted data; all percentages represent weighted data.
| Demographic and Other Characteristics | Method of consumption- |
χ2 |
P |
|
|---|---|---|---|---|
n* |
% |
|||
Gender |
||||
Male |
474 |
33.3 |
0.095 |
0.757 |
Female |
311 |
34.3 |
||
Age |
||||
16-19 |
93 |
39.1 |
36.526 |
0.000 |
20-24 |
206 |
44.9 |
||
25-34 |
256 |
35.6 |
||
35-44 |
119 |
31.8 |
||
45-54 |
62 |
25.9 |
||
55+ |
53 |
25.6 |
||
Region |
||||
West |
256 |
38.3 |
70.789 |
0.000 |
Ontario |
229 |
37.7 |
||
Quebec |
121 |
17.8 |
||
Atlantic |
183 |
33.0 |
||
Type of User |
||||
Infrequent |
230 |
25.7 |
75.508 |
0.000 |
Occasional |
200 |
35.9 |
||
Frequent |
359 |
42.6 |
||
Frequency of use to get stoned before going to/at school/college/university (12 months) |
||||
Infrequent |
61 |
44.5 |
15.323 |
0.002 |
Occasional |
34 |
56.5 |
||
Frequent |
22 |
39.5 |
||
Frequency of use to get stoned before going to/at work (12 months) |
||||
Infrequent |
96 |
32.1 |
19.156 |
0.000 |
Occasional |
47 |
43.4 |
||
Frequent |
66 |
45.4 |
||
Source: 2017 Canadian Cannabis Survey
*All sample sizes refer to non-weighted data; all percentages represent weighted data.
| Demographic and Other Characteristics | Method of consumption- |
χ2 |
P |
|
|---|---|---|---|---|
n* |
% |
|||
Gender |
||||
Male |
69 |
4.5 |
2.636 |
0.104 |
Female |
33 |
4.1 |
||
Age |
||||
16-19 |
- |
- |
- |
- |
20-24 |
- |
- |
||
25-34 |
- |
- |
||
35-44 |
- |
- |
||
45-54 |
- |
- |
||
55+ |
- |
- |
||
Region |
||||
West |
35 |
5.2 |
8.294 |
0.040 |
Ontario |
31 |
4.8 |
||
Quebec |
16 |
2.0 |
||
Atlantic |
20 |
3.7 |
||
Type of User |
||||
Infrequent |
- |
- |
- |
- |
Occasional |
- |
- |
||
Frequent |
- |
- |
||
Frequency of use to get stoned before going to/at school/college/university (12 months) |
||||
Infrequent |
9 |
6.7 |
21.079 |
0.000 |
Occasional |
7 |
12.7 |
||
Frequent |
6 |
12.9 |
||
Frequency of use to get stoned before going to/at work (12 months) |
||||
Infrequent |
15 |
4.7 |
41.900 |
0.000 |
Occasional |
10 |
9.4 |
||
Frequent |
19 |
12.9 |
||
Source: 2017 Canadian Cannabis Survey
*All sample sizes refer to non-weighted data; all percentages represent weighted data.
- signifies data are suppressed due to a small sample size and the large sampling variability associated with the estimates
| Demographic and Other Characteristics | Method of consumption- vaporizer |
χ2 |
P |
|
|---|---|---|---|---|
n* |
% |
|||
Gender |
||||
Male |
237 |
17.0 |
17.013 |
0.000 |
Female |
101 |
11.0 |
||
Age |
||||
16-19 |
25 |
10.1 |
17.484 |
0.004 |
20-24 |
87 |
17.8 |
||
25-34 |
128 |
18.0 |
||
35-44 |
43 |
11.2 |
||
45-54 |
31 |
13.4 |
||
55+ |
24 |
12.3 |
||
Region |
||||
West |
111 |
17.0 |
50.999 |
0.000 |
Ontario |
102 |
16.6 |
||
Quebec |
33 |
4.5 |
||
Atlantic |
92 |
15.8 |
||
Type of User |
||||
Infrequent |
56 |
5.9 |
118.441 |
0.000 |
Occasional |
84 |
14.3 |
||
Frequent |
198 |
25.3 |
||
Frequency of use to get stoned before going to/at school/college/university (12 months) |
||||
Infrequent |
19 |
13.4 |
12.939 |
0.005 |
Occasional |
14 |
22.2 |
||
Frequent |
10 |
19.3 |
||
Frequency of use to get stoned before going to/at work (12 months) |
||||
Infrequent |
44 |
14.4 |
53.514 |
0.000 |
Occasional |
27 |
21.3 |
||
Frequent |
45 |
34.1 |
||
Source: 2017 Canadian Cannabis Survey
*All sample sizes refer to non-weighted data; all percentages represent weighted data.
| Demographic and Other Characteristics | Method of consumption- |
χ2 |
P |
|
|---|---|---|---|---|
n* |
% |
|||
Gender |
||||
Male |
314 |
22.5 |
9.012 |
0.003 |
Female |
162 |
17.4 |
||
Age |
||||
16-19 |
63 |
26.5 |
31.474 |
0.000 |
20-24 |
129 |
28.0 |
||
25-34 |
153 |
21.5 |
||
35-44 |
70 |
17.2 |
||
45-54 |
35 |
16.4 |
||
55+ |
27 |
13.6 |
||
Region |
||||
West |
161 |
24.3 |
47.862 |
0.000 |
Ontario |
140 |
22.3 |
||
Quebec |
66 |
9.2 |
||
Atlantic |
110 |
19.3 |
||
Type of User |
||||
Infrequent |
103 |
10.9 |
116.326 |
0.000 |
Occasional |
115 |
21.0 |
||
Frequent |
259 |
31.8 |
||
Frequency of use to get stoned before going to/at school/college/university (12 months) |
||||
Infrequent |
40 |
28.6 |
27.835 |
0.000 |
Occasional |
25 |
42.5 |
||
Frequent |
16 |
32.8 |
||
Frequency of use to get stoned before going to/at work (12 months) |
||||
Infrequent |
54 |
17.0 |
18.970 |
0.000 |
Occasional |
33 |
28.4 |
||
Frequent |
44 |
32.9 |
||
Source: 2017 Canadian Cannabis Survey
*All sample sizes refer to non-weighted data; all percentages represent weighted data.
| Demographic and Other Characteristics | Method of consumption- |
χ2 |
P |
|
|---|---|---|---|---|
n* |
% |
|||
Gender |
||||
Male |
210 |
12.9 |
15.743 |
0.000 |
Female |
88 |
8.1 |
||
Age |
||||
16-19 |
- |
- |
- |
- |
20-24 |
- |
- |
||
25-34 |
- |
- |
||
35-44 |
- |
- |
||
45-54 |
- |
- |
||
55+ |
- |
- |
||
Region |
||||
West |
109 |
15.3 |
39.906 |
0.000 |
Ontario |
59 |
8.9 |
||
Quebec |
42 |
6.2 |
||
Atlantic |
90 |
14.8 |
||
Type of User |
||||
Infrequent |
26 |
2.4 |
235.736 |
0.000 |
Occasional |
54 |
8.2 |
||
Frequent |
220 |
23.8 |
||
Frequency of use to get stoned before going to/at school/college/university (12 months) |
||||
Infrequent |
27 |
18.2 |
42.723 |
0.000 |
Occasional |
20 |
34.4 |
||
Frequent |
19 |
35.0 |
||
Frequency of use to get stoned before going to/at work (12 months) |
||||
Infrequent |
45 |
14.5 |
138.370 |
0.000 |
Occasional |
28 |
22.1 |
||
Frequent |
57 |
37.5 |
||
Source: 2017 Canadian Cannabis Survey
*All sample sizes refer to non-weighted data; all percentages represent weighted data.
- signifies data are suppressed due to a small sample size and the large sampling variability associated with the estimates
| Demographic and Other Characteristics | Source of Cannabis |
|||||||||||||||
|---|---|---|---|---|---|---|---|---|---|---|---|---|---|---|---|---|
Grow my own |
Grown for me |
Shared around among group of friends |
Family member or a friend |
Acquaintance |
From a dealer or storefront dispensary |
Health Canada licensed producer by mail order |
χ2 |
P |
||||||||
n |
% |
n |
% |
n |
% |
n |
% |
n |
% |
n |
% |
n |
% |
|||
Gender |
||||||||||||||||
Male |
15 |
0.9 |
22 |
1.6 |
350 |
25.6 |
287 |
22.3 |
321 |
24.6 |
283 |
22.8 |
26 |
1.9 |
29.914 |
0.000 |
Female |
6 |
0.9 |
13 |
1.9 |
236 |
24.2 |
275 |
33.0 |
191 |
21.1 |
140 |
15.2 |
18 |
2.8 |
||
Age |
||||||||||||||||
16-19 |
2 |
0.5 |
4 |
2.1 |
85 |
35.9 |
42 |
20.9 |
29 |
11.5 |
64 |
26.9 |
3 |
1.4 |
132.491 |
0.000 |
20-24 |
5 |
1.4 |
5 |
0.9 |
147 |
31.1 |
97 |
22.3 |
82 |
15.6 |
118 |
26.6 |
6 |
1.6 |
||
25-34 |
7 |
1.1 |
12 |
1.6 |
184 |
25.1 |
200 |
27.0 |
168 |
21.6 |
132 |
21.3 |
13 |
1.6 |
||
35-44 |
2 |
0.4 |
5 |
1.1 |
94 |
25.0 |
96 |
24.9 |
102 |
26.5 |
63 |
18.6 |
11 |
3.6 |
||
45-54 |
4 |
1.1 |
1 |
0.5 |
40 |
17.5 |
72 |
30.5 |
78 |
31.9 |
31 |
13.4 |
8 |
4.2 |
||
55+ |
1 |
0.7 |
8 |
3.8 |
36 |
17.3 |
61 |
33.4 |
55 |
30.2 |
17 |
11.6 |
4 |
1.9 |
||
Region |
||||||||||||||||
Atlantic Canada |
5 |
1.1 |
9 |
2.1 |
126 |
24.8 |
152 |
30.9 |
118 |
23.6 |
82 |
15.1 |
10 |
2.1 |
74.116 |
0.000 |
Quebec |
6 |
1.0 |
11 |
3.0 |
177 |
29.5 |
105 |
17.7 |
173 |
34.5 |
82 |
13.3 |
4 |
0.6 |
||
Ontario |
5 |
0.9 |
9 |
1.7 |
135 |
24.1 |
143 |
28.1 |
100 |
19.7 |
128 |
22.0 |
13 |
2.5 |
||
Western Canada |
5 |
0.8 |
6 |
1.0 |
148 |
23.5 |
168 |
29.5 |
123 |
20.9 |
133 |
21.2 |
18 |
3.0 |
||
Type of user |
||||||||||||||||
Infrequent |
5 |
0.5 |
7 |
0.9 |
396 |
40.3 |
259 |
30.2 |
147 |
16.9 |
72 |
9.0 |
12 |
1.6 |
409.603 |
0.000 |
Occasional |
5 |
0.5 |
10 |
1.7 |
121 |
20.1 |
148 |
29.8 |
152 |
28.8 |
88 |
16.5 |
11 |
2.2 |
||
Frequent |
11 |
1.8 |
18 |
2.8 |
69 |
8.6 |
161 |
20.2 |
215 |
27.1 |
265 |
35.7 |
22 |
3.3 |
||
n |
% |
n |
% |
n |
% |
n |
% |
n |
% |
n |
% |
n |
% |
χ2 |
P |
|
Days on which started mornings using non-medical cannabis (30 days) |
||||||||||||||||
I have not done this |
5 |
0.3 |
21 |
2.4 |
217 |
20.5 |
254 |
28.0 |
230 |
24.7 |
18 |
20.7 |
3 |
2.5 |
107.617 |
0.000 |
1 day |
3 |
3.0 |
2 |
1.6 |
14 |
13.7 |
25 |
20.0 |
28 |
26.6 |
2 |
32.7 |
0 |
2.5 |
||
2 to 3 days |
3 |
2.5 |
2 |
1.3 |
17 |
10.9 |
34 |
24.6 |
42 |
28.9 |
3 |
29.2 |
1 |
2.3 |
||
1 or 2 day(s) per week |
2 |
2.8 |
1 |
0.2 |
11 |
11.9 |
19 |
19.3 |
41 |
22.8 |
4 |
38.6 |
1 |
4.2 |
||
3 or 4 days per week |
2 |
2.4 |
1 |
1.4 |
5 |
7.4 |
7 |
12.4 |
27 |
25.7 |
3 |
44.6 |
0 |
6.0 |
||
5 to 6 days per week |
1 |
1.2 |
0 |
0.3 |
2 |
5.8 |
4 |
24.2 |
11 |
20.3 |
1 |
47.6 |
0 |
0.9 |
||
Daily |
2 |
2.1 |
3 |
3.5 |
13 |
8.5 |
20 |
15.1 |
44 |
29.5 |
5 |
37.8 |
0 |
3.4 |
||
Hours stoned or 'high' on a typical day using cannabis for non-medical purposes (30 days) |
||||||||||||||||
Less than 1 hour |
4 |
2.2 |
9 |
3.0 |
65 |
21.1 |
67 |
24.1 |
79 |
28.0 |
45 |
17.4 |
7 |
4.2 |
78.931 |
0.000 |
1 or 2 hour(s) |
5 |
0.5 |
12 |
2.3 |
121 |
17.3 |
153 |
26.6 |
165 |
27.0 |
129 |
23.2 |
10 |
1.9 |
||
3 or 4 hours |
3 |
0.8 |
7 |
1.9 |
67 |
15.9 |
95 |
24.8 |
98 |
23.8 |
113 |
30.1 |
9 |
2.5 |
||
5 or 6 hours |
1 |
1.1 |
2 |
0.9 |
16 |
11.1 |
35 |
26.5 |
23 |
16.3 |
46 |
39.3 |
6 |
4.7 |
||
7 or more hours |
5 |
3.7 |
0 |
0.0 |
- |
- |
13 |
10.6 |
26 |
28.0 |
42 |
45.2 |
4 |
2.8 |
||
Did you buy it [cannabis] or was it given for free? |
||||||||||||||||
I bought it/bartered for it |
-- |
-- |
21 |
1.8 |
-- |
-- |
300 |
26.8 |
394 |
35.3 |
390 |
36.1 |
-- |
-- |
212.322 |
0.000 |
It was given for free |
-- |
-- |
14 |
4.0 |
-- |
-- |
266 |
63.4 |
119 |
26.1 |
24 |
6.5 |
-- |
-- |
||
In the past 12 months, have you sold/resold or traded the cannabis you obtained to others? |
||||||||||||||||
Yes |
9 |
3.0 |
6 |
1.8 |
35 |
12.9 |
56 |
23.2 |
65 |
24.4 |
86 |
33.0 |
3 |
0.3 |
72.129 |
0.000 |
No |
12 |
0.7 |
29 |
1.7 |
551 |
26.4 |
512 |
27.2 |
449 |
23.0 |
339 |
18.0 |
42 |
0.6 |
||
In the past 12 months, have you shared or gifted any of the cannabis you obtained for non medical purposes with others by passing a joint/bong/pipe around in a group? |
||||||||||||||||
Yes |
17 |
1.3 |
24 |
1.6 |
324 |
22.4 |
365 |
26.2 |
329 |
22.4 |
324 |
23.8 |
27 |
2.0 |
53.890 |
0.000 |
No |
4 |
0.3 |
11 |
1.9 |
262 |
28.7 |
203 |
27.7 |
185 |
24.2 |
101 |
13.4 |
18 |
2.7 |
||
n |
% |
n |
% |
n |
% |
n |
% |
n |
% |
n |
% |
n |
% |
χ2 |
P |
|
In the past 12 months, have you shared or gifted any of the cannabis you obtained for non medical purposes with others, not including sharing while consuming (e.g., passing a joint/bong/pipe around in a group)? |
||||||||||||||||
Yes |
12 |
1.6 |
17 |
2.4 |
118 |
16.3 |
180 |
23.5 |
192 |
26.0 |
202 |
27.7 |
17 |
2.1 |
98.023 |
0.000 |
No |
9 |
0.6 |
18 |
1.4 |
468 |
29.1 |
388 |
28.4 |
322 |
21.7 |
223 |
15.7 |
28 |
2.4 |
||
Frequency of use to get stoned before going to/at school/college/university (12 months) |
||||||||||||||||
Infrequent |
1 |
0.3 |
0 |
0 |
58 |
42.8 |
22 |
18.0 |
20 |
12.6 |
35 |
26.3 |
0 |
0 |
75.669 |
0.000 |
Occasional |
0 |
0 |
0 |
0 |
8 |
16.3 |
12 |
23.0 |
12 |
17.2 |
22 |
38.5 |
2 |
3.9 |
||
Frequent |
0 |
0 |
0 |
0 |
7 |
11.7 |
12 |
27.4 |
5 |
8.6 |
39 |
52.3 |
0 |
0 |
||
Have not done this in the past 12 months |
1 |
0.5 |
3 |
1.1 |
114 |
37.2 |
83 |
30.0 |
41 |
13.3 |
47 |
16.3 |
1 |
0.1 |
||
Frequency of non-medical use to get high before going to/at work (12 months) |
||||||||||||||||
Infrequent |
4 |
1.1 |
5 |
1.9 |
66 |
19.7 |
53 |
22.0 |
65 |
24.5 |
66 |
27.0 |
8 |
3.3 |
105.161 |
0.000 |
Occasional |
1 |
1.2 |
0 |
0 |
16 |
14.4 |
18 |
15.8 |
31 |
23.0 |
40 |
42.6 |
3 |
3.0 |
||
Frequent |
4 |
3.2 |
2 |
0.6 |
12 |
8.1 |
25 |
17.8 |
39 |
30.7 |
45 |
36.9 |
2 |
2.2 |
||
Have not done this in the past 12 months |
12 |
0.7 |
28 |
1.9 |
503 |
27.6 |
472 |
28.8 |
379 |
22.4 |
274 |
15.9 |
32 |
2.1 |
||
Source: 2017 Canadian Cannabis Survey
*All sample sizes refer to non-weighted data; all percentages represent weighted data.- signifies data are suppressed due to a small sample size and the large sampling variability associated with the estimates
| Demographic Characteristics and Other Variables | Does using cannabis for non-medical purposes impair ability to drive a vehicle (yes) |
|||
|---|---|---|---|---|
n* |
% |
χ2 |
P |
|
Gender |
||||
Male |
3,340 |
80.4 |
46.092 |
0.000 |
Female |
3,395 |
85.0 |
||
Age |
||||
16-19 |
378 |
68.5 |
329.371 |
0.000 |
20-24 |
675 |
69.2 |
||
25-34 |
1,506 |
73.7 |
||
35-44 |
1,376 |
82.7 |
||
45-54 |
1,273 |
88.4 |
||
55+ |
1,545 |
89.1 |
||
Region |
||||
West |
1,708 |
80.4 |
35.814 |
0.000 |
Ontario |
1,565 |
82.6 |
||
Quebec |
1,942 |
87.0 |
||
Atlantic |
1,538 |
79.4 |
||
Type of User |
||||
Infrequent |
663 |
74.8 |
383.740 |
0.000 |
Occasional |
269 |
49.6 |
||
Frequent |
221 |
30.9 |
||
Driven a vehicle within 2 hours of using cannabis |
||||
Yes |
269 |
22.0 |
349.703 |
0.000 |
No |
325 |
64.4 |
||
It Depends |
342 |
56.0 |
||
Source: 2017 Canadian Cannabis Survey
*All sample sizes refer to non-weighted data; all percentages represent weighted data.
| Demographic Characteristics and Other Variables | Have you driven a motor vehicle within 2 hours of using non-medical cannabis? (yes) |
|||
|---|---|---|---|---|
n* |
% |
χ2 |
P |
|
Gender |
||||
Male |
665 |
44.6 |
47.652 |
0.000 |
Female |
309 |
31.1 |
||
Age |
||||
16-19 |
71 |
27.8 |
31.581 |
0.000 |
20-24 |
215 |
43.1 |
||
25-34 |
351 |
45.2 |
||
35-44 |
174 |
42.7 |
||
45-54 |
104 |
37.5 |
||
55+ |
64 |
30.4 |
||
Region |
||||
West |
300 |
45.8 |
23.211 |
0.000 |
Ontario |
212 |
34.1 |
||
Quebec |
222 |
36.0 |
||
Atlantic |
245 |
41.9 |
||
Type of User |
||||
Infrequent |
206 |
20.7 |
322.937 |
0.000 |
Occasional |
247 |
41.9 |
||
Frequent |
526 |
60.0 |
||
Source: 2017 Canadian Cannabis Survey
*All sample sizes refer to non-weighted data; all percentages represent weighted data.
| Demographic Characteristics and Other Variables | Driven vehicle within 2 hours of using non-medical cannabis with alcohol (yes) |
|||
|---|---|---|---|---|
n* |
% |
χ2 |
P |
|
Gender |
||||
Male |
110 |
16.2 |
2.948 |
0.086 |
Female |
38 |
12.9 |
||
Age |
||||
16-19 |
9 |
11.4 |
5.817 |
0.324 |
20-24 |
34 |
14.6 |
||
25-34 |
53 |
15.0 |
||
35-44 |
25 |
14.5 |
||
45-54 |
13 |
11.5 |
||
55+ |
16 |
22.5 |
||
Region |
||||
West |
42 |
13.8 |
4.671 |
0.198 |
Ontario |
28 |
14.3 |
||
Quebec |
44 |
20.0 |
||
Atlantic |
36 |
16.3 |
||
Type of User |
||||
Infrequent |
59 |
29.6 |
35.871 |
0.000 |
Occasional |
27 |
11.5 |
||
Frequent |
64 |
10.8 |
||
Source: 2017 Canadian Cannabis Survey
*All sample sizes refer to non-weighted data; all percentages represent weighted data.
| Demographic Characteristics and Other Variables | Driven vehicle within 2 hours of using non-medical cannabis with other drugs (yes) |
|||
|---|---|---|---|---|
n* |
% |
χ2 |
P |
|
Gender |
||||
Male |
56 |
9.2 |
3.971 |
0.044 |
Female |
15 |
5.3 |
||
Age |
||||
16-19 |
6 |
5.7 |
3.842 |
0.572 |
20-24 |
15 |
7.6 |
||
25-34 |
21 |
6.4 |
||
35-44 |
14 |
8.4 |
||
45-54 |
7 |
6.8 |
||
55+ |
8 |
13.0 |
||
Region |
||||
West |
21 |
7.4 |
5.245 |
1.55 |
Ontario |
15 |
7.5 |
||
Quebec |
23 |
10.8 |
||
Atlantic |
12 |
5.3 |
||
Type of User |
||||
Infrequent |
20 |
10.1 |
2.348 |
0.309 |
Occasional |
16 |
8.2 |
||
Frequent |
35 |
6.8 |
||
Source: 2017 Canadian Cannabis Survey
*All sample sizes refer to non-weighted data; all percentages represent weighted data.
| Demographic Characteristics and Other Variables | Passenger in a vehicle by someone who used non-medical cannabis within 2 hours? (yes) |
|||
|---|---|---|---|---|
n* |
% |
χ2 |
P |
|
Gender |
||||
Male |
2,125 |
44.4 |
91.526 |
0.000 |
Female |
1,593 |
33.6 |
||
Age |
||||
16-19 |
227 |
40.9 |
449.252 |
0.000 |
20-24 |
567 |
55.6 |
||
25-34 |
1,191 |
57.6 |
||
35-44 |
738 |
44.0 |
||
45-54 |
501 |
33.2 |
||
55+ |
515 |
27.7 |
||
Region |
||||
West |
1,008 |
44.1 |
64.555 |
0.000 |
Ontario |
792 |
36.8 |
||
Quebec |
940 |
33.7 |
||
Atlantic |
999 |
46.7 |
||
Type of User |
||||
Infrequent |
600 |
65.4 |
194.503 |
0.000 |
Occasional |
467 |
81.8 |
||
Frequent |
767 |
91.7 |
||
Source: 2017 Canadian Cannabis Survey
*All sample sizes refer to non-weighted data; all percentages represent weighted data.
| Demographic Characteristics and Other Variables | Police contact for possession of non-medical cannabis (yes) |
|
|---|---|---|
n* |
% |
|
Gender |
||
Male |
44 |
84.7 |
Female |
- |
- |
Age |
||
16-19 |
16 |
28.8 |
20-24 |
17 |
24.8 |
25-34 |
15 |
30.4 |
35-44 |
-- |
- |
45-54 |
- |
- |
55+ |
- |
- |
Region |
||
West |
16 |
36.0 |
Ontario |
14 |
39.1 |
Quebec |
14 |
18.0 |
Atlantic |
11 |
6.9 |
Type of User |
||
Infrequent |
- |
- |
Occasional |
- |
- |
Frequent |
40 |
71.2 |
Source: 2017 Canadian Cannabis Survey
*All sample sizes refer to non-weighted data; all percentages represent weighted data.
- signifies data are suppressed due to a small sample size and the large sampling variability associated with the estimates
| Demographic Characteristics and Other Variables | n* |
Mean Price/g (weighted) |
Test Statistic (F) (unweighted) |
Significance (unweighted) |
|---|---|---|---|---|
Gender |
||||
Male |
797 |
10.01 |
8.796 |
.003 |
Female |
421 |
14.11 |
||
Age |
||||
16-19 |
128 |
9.20 |
.268 |
.931 |
20-24 |
278 |
9.98 |
||
25-34 |
405 |
12.68 |
||
35-44 |
215 |
10.33 |
||
45-54 |
117 |
12.00 |
||
55+ |
82 |
13.20 |
||
Region |
||||
West |
319 |
12.08 |
2.657 |
.047 |
Ontario |
313 |
12.48 |
||
Quebec |
287 |
8.11 |
||
Atlantic |
306 |
9.78 |
||
Frequency of Use (last 12 months) |
||||
Infrequent |
141 |
21.89 |
14.807 |
.000 |
Occasional |
385 |
12.15 |
||
Frequent |
699 |
8.77 |
||
Days on which started mornings using non-medical cannabis (30 days) |
||||
Have not done this |
691 |
13.09 |
0.921 |
0.479 |
1 day |
95 |
9.08 |
||
2 to 3 |
135 |
10.80 |
||
1 or 2 days per week |
103 |
9.64 |
||
3 or 4 days per week |
56 |
8.25 |
||
5 or 6 days per week |
23 |
7.77 |
||
Daily |
122 |
7.92 |
||
Hours stoned or 'high' on a typical day using cannabis for non-medical purposes (30 days) |
||||
Less than 1 hour |
191 |
12.55 |
1.411 |
0.228 |
1 or 2 hour(s) |
477 |
13.33 |
||
3 or 4 hours |
343 |
9.42 |
||
5 or 6 hours |
115 |
9.20 |
||
7 or more hours |
99 |
8.16 |
||
Number of people/sources non-medical cannabis obtained from (past 12 month). |
||||
I grew all the cannabis I used myself |
16 |
7.61 |
1.014 |
0.399 |
1 source/person |
483 |
12.71 |
||
2 or 3 sources/people |
558 |
11.04 |
||
4 or 5 sources/people |
81 |
8.74 |
||
6 or more sources/people |
87 |
8.43 |
||
Source of non-medical cannabis |
||||
I grow my own |
14 |
10.75 |
2.706 |
.009 |
It was grown for me |
19 |
14.08 |
||
It was shared around a group of friends |
180 |
13.31 |
||
From a family member or friend |
247 |
9.66 |
||
From an acquaintance |
321 |
13.37 |
||
From a dealer or storefront dispensary |
340 |
9.69 |
||
Health Canada licensed producer by mail order |
31 |
8.24 |
||
Other |
4 |
63.82 |
||
Did you buy it [non-medical cannabis] or was it given for free? |
||||
I bought it/bartered for it |
836 |
9.30 |
26.737 |
.000 |
It was given for free |
83 |
27.83 |
||
Frequency of purchase/receipt of dried/leaf non-medical cannabis (30 days) |
||||
1 day per month |
601 |
12.82 |
0.918 |
0.468 |
2 to 3 days per month |
375 |
10.30 |
||
1 to 2 days per week |
155 |
8.99 |
||
3 to 4 days per week |
25 |
9.02 |
||
5 to 6 days per week |
24 |
6.78 |
||
Daily |
45 |
9.94 |
||
Frequency of use to get stoned before going to/at school/college/university (12 months) |
||||
Infrequent |
84 |
9.62 |
2.290 |
0.079 |
Occasional |
48 |
8.36 |
||
Frequent |
49 |
7.80 |
||
Have not done this in the past 12 months |
108 |
11.12 |
||
Frequency of non-medical use to get high before going to/at work (12 months) |
||||
Infrequent |
162 |
11.03 |
1.828 |
0.140 |
Occasional |
99 |
7.63 |
||
Frequent |
116 |
14.56 |
||
Have not done this in the past 12 months |
848 |
11.45 |
||
*All sample sizes refer to non-weighted data; all means represent weighted data.
| Demographic Characteristics and Other Variables | n* |
Quantity Consumed (g) (weighted) |
Test Statistic (F) (unweighted) |
Significance (unweighted) |
|---|---|---|---|---|
Gender |
||||
Male |
1256 |
0.98 |
8.918 |
.003 |
Female |
816 |
0.79 |
||
Age |
||||
16-19 |
226 |
1.04 |
1.626 |
.150 |
20-24 |
432 |
1.07 |
||
25-34 |
677 |
0.87 |
||
35-44 |
349 |
0.91 |
||
45-54 |
212 |
0.79 |
||
55+ |
186 |
0.78 |
||
Region |
||||
West |
559 |
0.92 |
1.726 |
.160 |
Ontario |
520 |
0.93 |
||
Quebec |
521 |
0.73 |
||
Atlantic |
482 |
1.07 |
||
Frequency of Use (last 12 months) |
||||
Infrequent |
825 |
0.49 |
74.201 |
.000 |
Occasional |
524 |
0.68 |
||
Frequent |
733 |
1.55 |
||
Days on which started mornings using non-medical cannabis (30 days) |
||||
Have not done this |
885 |
0.68 |
29.745 |
.000 |
1 day |
103 |
1.11 |
||
2 to 3 |
135 |
1.50 |
||
1 or 2 days per week |
100 |
1.55 |
||
3 or 4 days per week |
58 |
2.03 |
||
5 or 6 days per week |
23 |
2.22 |
||
Daily |
119 |
2.65 |
||
Hours stoned or 'high' on a typical day using cannabis for non-medical purposes (30 days) |
||||
Less than 1 hour |
257 |
0.94 |
26.013 |
.000 |
1 or 2 hour(s) |
574 |
0.80 |
||
3 or 4 hours |
372 |
1.30 |
||
5 or 6 hours |
120 |
1.37 |
||
7 or more hours |
100 |
2.47 |
||
Number of people/sources non-medical cannabis obtained from (past 12 month). |
||||
I grew all the cannabis I used myself |
50 |
0.94 |
10.110 |
.000 |
1 source/person |
1017 |
0.74 |
||
2 or 3 sources/people |
827 |
0.99 |
||
4 or 5 sources/people |
91 |
1.35 |
||
6 or more sources/people |
97 |
1.62 |
||
Source of non-medical cannabis |
||||
I grow my own |
20 |
2.79 |
6.775 |
.000 |
It was grown for me |
29 |
0.89 |
||
It was shared around a group of friends |
529 |
0.61 |
||
From a family member or friend |
491 |
0.79 |
||
From an acquaintance |
435 |
0.91 |
||
From a dealer or storefront dispensary |
380 |
1.33 |
||
Health Canada licensed producer by mail order |
40 |
1.08 |
||
Other |
8 |
0.62 |
||
Did you buy it [non-medical cannabis] or was it given for free? |
||||
I bought it/bartered for it |
975 |
1.16 |
37.138 |
.000 |
It was given for free |
348 |
0.54 |
||
Frequency of purchase/receipt of dried/leaf non-medical cannabis (30 days) |
||||
1 day per month |
747 |
0.64 |
42.002 |
.000 |
2 to 3 days per month |
379 |
1.42 |
||
1 to 2 days per week |
148 |
1.99 |
||
3 to 4 days per week |
24 |
2.33 |
||
5 to 6 days per week |
20 |
2.52 |
||
Daily |
46 |
3.93 |
||
Frequency of use to get stoned before going to/at school/college/university (12 months) |
||||
Infrequent |
127 |
0.86 |
25.197 |
.000 |
Occasional |
53 |
1.68 |
||
Frequent |
47 |
2.08 |
||
Have not done this in the past 12 months |
288 |
0.53 |
||
Frequency of non-medical use to get high before going to/at work (12 months) |
||||
Infrequent |
226 |
1.10 |
38.376 |
.000 |
Occasional |
96 |
1.74 |
||
Frequent |
122 |
2.37 |
||
Have not done this in the past 12 months |
1638 |
0.72 |
||
*All sample sizes refer to non-weighted data; all means represent weighted data.
Footnotes
- 1
Source: https://www.canada.ca/en/health-canada/services/canadian-tobacco-alcohol-drugs-survey/2015-supplementary-tables.html#a11 (accessed on September 13, 2018).
- 2
These objectives were established to:
* Protect young Canadians by keeping cannabis out of the hands of children and youth;
* Keep profits out of the hands of criminals, particularly organized crime;
* Reduce the burdens on police and the justice system associated with simple possession of cannabis offences;
* Prevent Canadians from entering the criminal justice system and receiving criminal records for simple cannabis possession offences;
* Protect public health and safety by strengthening, where appropriate, laws and enforcement measures that deter and punish more serious cannabis offences, particularly selling and distributing to children and youth, selling outside of the regulatory framework, and operating a motor vehicle while under the influence of cannabis;
* Ensure Canadians are well-informed through sustained and appropriate public health campaigns and, for youth in particular, ensure that risks are understood;
* Establish and enforce a strict system of production, distribution and sales, taking a public health approach, with regulation of quality and safety (e.g., child-proof packaging, warning labels), restriction of access, and application of taxes, with programmatic support for addiction treatment, mental health support and education programs;
* Provide access to quality-controlled cannabis for medical purposes consistent with federal policy and court decisions; and
* Enable ongoing data collection, including gathering baseline data, to monitor the impact of the new framework. - 3
Another possible explanation for some of the difference is that CTADS is a telephone interview while CCS is completed online. The theory of social desirability maintains that some respondents may be more reluctant to admit a socially undesirable behaviour such as use of cannabis in person or over the phone than online.
- 4
If respondents indicated they had used cannabis for medical purposes, they were invited to complete another set of questions about beliefs and behaviours around medical use. As noted, the current analyses only consider those questions related to cannabis use for non-medical purposes.
- 5
The reader is invited to contact the authors to obtain the data if they wish to replicate the weighted percentages presented in the report.
- 6
https://www.canada.ca/en/health-canada/services/drugs-medication/cannabis/health-effects/effects.html
- 7
For each of the consumption methods considered in the CCS (smoked, eaten in food, drank it, vaporized it with a vaporizer, vaporized it with a vape pen or e-cigarette and dabbing), those who used cannabis were asked in the past 12 months, did you use the following method to consume cannabis for non-medical purposes?
- 8
Respondents were able to select more than one option for how they consumed cannabis in the 12 months previous to the survey.
- 9
Dabbing is the flash vaporization of cannabis concentrates once applied to a hot surface and inhaled.
- 10
Results related to drinking cannabis by age group were suppressed given the large coefficient of variance.
- 11
Interpret with caution given the small sample size and the moderate sampling variability associated with the estimates.
- 12
Results related to dabbing cannabis were suppressed for all other age groups given the large coefficient of variance.
- 13
Interpret with caution given the moderate sampling variability associated with the estimates.
- 14
Interpret with caution given the moderate sampling variability associated with the estimates.
- 15
For simplicity of language, the terms infrequent, occasional and frequent user will be used to refer to behaviours involving the use of cannabis related to frequency of use. In particular, infrequent users reported using cannabis less than 1 day/month to 1 day/month; occasional users reported using cannabis 2-3 days/month to 1 or 2 days/week; frequent users reported using cannabis 3-4 days/week, 5-6 days/week or daily.
- 16
These questions were asked only of students who reported using cannabis in the past 12 months.
- 17
Interpret with caution given the small sample and the moderate sampling variability associated with the estimates.
- 18
Interpret with caution given the small sample and the moderate sampling variability associated with the estimates.
- 19
There is one more type of source “other.” However, it was not included in the analysis due to very low counts (0.6% of respondents) and vagueness of the concept.
- 20
Interpret with caution given the small sample and the moderate sampling variability associated with the estimates.
- 21
Unlike in the NCS, no multiple responses were allowed in the CCS to the question on sources of cannabis. Therefore, the results from the two surveys are not directly comparable.
- 22
Source: https://www150.statcan.gc.ca/n1/en/daily-quotidien/180418/dq180418b-eng.pdf?st=YQve-nhO
- 23
Interpret with caution given the moderate sampling variability associated with the estimates.
- 24
Interpret with caution given the small sample and the moderate sampling variability associated with the estimates.
- 25
These questions were only asked to those who reported using cannabis in the past 30 days: 1) In the past 30 days, how many mornings did you start your day by using cannabis for non-medical purposes?; 2) In the past 30 days, how many hours were you stoned or 'high' on a typical day when you had been using cannabis for non-medical purposes?
- 26
Interpret with caution given the small sample and the moderate sampling variability associated with the estimates.
- 27
Very small counts. Interpret with caution.
- 28
Interpret with caution given the small sample and the moderate sampling variability associated with the estimates.
- 29
This question was only shown to people who indicated their usual source in the previous question was : It was grown for me, From a family member or friend, From an acquaintance or From a dealer or storefront dispensary.
- 30
Respondents who used cannabis were asked: Did you buy it [cannabis] or was it given for free?
- 31
Respondents who used cannabis were asked: In the past 12 months, have you sold/resold or traded the cannabis you obtained to others?
- 32
Interpret with caution given the moderate sampling variability associated with the estimates.
- 33
Respondents who used cannabis were asked: In the past 12 months, have you shared or gifted any of the cannabis you obtained for non-medical purposes with others by passing a joint/bong/pipe around in a group?
- 34
Respondents who used cannabis were asked: In the past 12 months, have you shared or gifted any of the cannabis you obtained for non-medical purposes with others, not including sharing while consuming (e.g., passing a joint/bong/pipe around in a group)?
- 35
These questions were asked only of students who reported using cannabis in the past 12 months: 1) In the past 12 months, how often did you use cannabis for non-medical purposes to get stoned or high before going to, or while at, school/college/university? ; and 2) In the past 12 months, how often did you use cannabis for non-medical purposes to get stoned or high before going to, or while at, work? Infrequent users reported using cannabis less than 1 day/month to 1 day/month; occasional users reported using cannabis 2-3 days/month to 1 or 2 days/week; frequent users reported using cannabis 3-4 days/week, 5-6 days/week or daily.
- 36
Interpret with caution given the small sample size and the moderate sampling variability associated with the estimates.
- 37
The exact CCS questions on DID beliefs were: In your opinion, does using cannabis for non-medical purposes impair one’s ability to drive or operate a vehicle? And As far as you know, when is it safe for someone to drive a vehicle after using cannabis for non-medical purposes?
- 38
There were no additional significant differences between beliefs about DID and driving a vehicle within 2 hours of using cannabis with alcohol and using cannabis with other drugs.
- 39
These results are much higher than those reported in the 2018 National Cannabis Survey (3rd quarter), which found that 14% of cannabis users with a valid driver’s license said they had driven within 2 hours of use. Additionally, a study with Canadians on drug-impaired driving (EKOS, 2017) found that of those reporting cannabis use in the 12 months prior to this study, 28% reported they had operated a vehicle while under the influence.
- 40
There were non-statistical results for gender, age and region for driving within 2 hours of having used non-medical cannabis and alcohol.
- 41
Interpret with caution given the small sample size and the moderate sampling variability associated with the estimates.
- 42
There were non-statistical results for age, region and user type for driving within 2 hours of having used non-medical cannabis combined with other drugs.
- 43
No definition of ‘other drugs’ was provided to respondents.
- 44
Interpret with caution given the small sample size and the moderate sampling variability associated with the estimates.
- 45
These results are based on self-reported data of 2,132 respondents.
- 46
The exact question from the 2017 CCS is: In the past 12 months, did you personally have an interaction with law enforcement involving your personal possession of cannabis for non-medical purposes?
- 47
It should be noted that only those who indicated they had interaction with law enforcement are considered in this analysis.
- 48
Interpret with caution given the small sample size and the moderate sampling variability associated with the estimates.
- 49
Interpret with caution given the small sample size and the moderate sampling variability associated with the estimates.
- 50
Results presented in this section of the paper are unweighted because weights were created to represent cannabis users based on age, region and gender. As such, average prices and quantities presented are actual responses.
- 51
Respondents who used cannabis were asked: How much do you typically spend on cannabis for non-medical purposes each month?
- 52
Respondents who used cannabis were asked: How much did you spend on cannabis for non-medical purposes in the past 30 days?
- 53
The question on the price of cannabis was only asked about the 30 days prior to the survey, not 12 months like the majority of other questions in the survey.
- 54
Respondents who used cannabis were asked: Typically, how much cannabis in the form: Dried flower/leaf (smoked or vaporized) did you buy or receive each time for non-medical purposes? (units: g)
- 55
Respondents who used cannabis were asked: How much did you pay for this amount?
- 56
A new variable measuring the price per gram of dried/leaf cannabis was computed. The total price users paid for the transaction was divided by the quantity of cannabis they purchased (in grams). The resulting number is the price per gram of dried/leaf cannabis. This number will be used throughout the rest of the report.
- 57
Transactions that listed $0.00 paid for dried/leaf cannabis were excluded from the analysis. The reason behind the exclusion is because the authors felt that the average price for cannabis should reflect the actual monetary exchange, not the gifting, nature of the transactions.
- 58
Respondents who used cannabis were asked: On the days that you used: Dried flower/leaf (smoked or vaporized) How much did you typically use in a day? (units: g)
- 59
Infrequent users reported using cannabis less than 1 day/month to 1 day/month; occasional users reported using cannabis 2-3 days/month to 1 or 2 days/week; frequent users reported using cannabis 3-4 days/week, 5-6 days/week or daily.
- 60
Respondents who used cannabis were asked: How old were you when you first tried or started using cannabis for non-medical purposes? (units: years)
- 61
Respondents who used cannabis were asked: 1) In the past 30 days, how many mornings did you start your day by using cannabis for non-medical purposes?; 2) In the past 30 days, how many hours were you stoned or 'high' on a typical day when you had been using cannabis for non-medical purposes?
- 62
Respondents who used cannabis were asked: In the past 30 days, how many hours were you stoned or 'high' on a typical day when you had been using cannabis for non-medical purposes?
- 63
Respondents who used cannabis were asked: In the past 12 months, how many different people/sources have you obtained cannabis for non-medical purposes from?
- 64
Respondents who used cannabis were asked: In the past 12 months from whom did you usually obtain the cannabis you used for non-medical purposes from?
- 65
Respondents who used cannabis were asked: 1) In the past 12 months, how often did you use cannabis for non-medical purposes to get stoned or high before going to, or while at, school/college/university?; and 2) In the past 12 months, how often did you use cannabis for non-medical purposes to get stoned or high before going to, or while at, work? Infrequent users reported using cannabis less than 1 day/month to 1 day/month; occasional users reported using cannabis 2-3 days/month to 1 or 2 days/week; frequent users reported using cannabis 3-4 days/week, 5-6 days/week or daily.
- Date modified: