Crime Prevention in Canada: Implementation Challenges and Strategies to Overcome Them
 Crime Prevention in Canada: Implementation Challenges and Strategies to Overcome Them - PDF Version (471 KB)
 Table of contents
- Introduction
- Methodology
- Description of Projects and Services Delivered
- Projects Focusing on Children and Youth
- Projects Focusing on Parents
- Projects Focusing on Adults
- Project Management, Advisory Group and Volunteers, Project Planning and Issues Related to Staffing
- Relationships with Partners
- Project Fidelity and Adaptations
- Data Management Issues
- Most Significant Implementation Challenges and the Strategies Used to Address Them
- Most Common Strategies of Project Implementation
- Lessons Learned of Project Implementation
- Key Conclusions
- Appendix A: Definitions of Crime Prevention Program Types
Abstract
This report presents the results of an analysis of implementation data from seventy-one crime prevention projects funded by Public Safety Canada's National Crime Prevention Strategy (NCPS). The data used in this report was retrospectively extracted from project documents and entered in a comprehensive database that was designed to record implementation challenges and strategies.
Most of the implementation challenges faced by the projects were related to the following topics: data management and completion of forms; recruitment, referrals and retention of participants and parents; developing adaptations to address participant needs; staff hiring, turnover and training; funding and resources; obtaining appropriate facilities/sites and accessibility; partnership building and maintenance; and administration and management.
Key strategies to address the challenges were adapting the program content to meet participant needs - for example, adding cultural components; providing a diverse range of activities that interested participants; using a proactive approach to support recruitment and remaining flexible in order to address challenges like staff turnover; focusing on project monitoring and systematic delivery; hiring experienced, caring and empathic staff that were able to design activities related to participants ‘needs'; and building strong relationships with families and with community partners.
The results from this study provide information on common challenges associated with implementing crime prevention projects as well as the most common strategies to address them. Data are too limited to make a direct link with outcomes achieved by the projects but we can extrapolate that the more a project faces multiple and complex implementation challenges, the more it is difficult to achieve the expected outcomes. This report provides real life anecdotes and concrete project information and it should be used to inform the implementation of any new crime prevention project.
Author's Note
The views expressed are those of the authors and do not necessarily reflect those of Public Safety Canada. Correspondence concerning this report should be addressed to: Research Division, Public Safety Canada, 340 Laurier Avenue West, Ottawa, Ontario, K1A 0P8; email: PS.CPBResearch-RechercheSPC.SP@ps-sp.gc.ca.
Acknowledgements
Sincere thanks to Julie Savignac, Marion Cook and Shelley Tyler of Public Safety Canada for their consistent and helpful support in completing this project. Special thanks to Julie for coordinating all aspects of the project so effectively.
Product Information:
© Her Majesty the Queen in Right of Canada, 2016
Cat. No.: PS18-27/2015E-PDF
ISBN Number: 978-0-660-03652-6
Introduction
This report presents the results of an external contract on the analysis of implementation data from seventy-one crime prevention projects funded by Public Safety Canada's National Crime Prevention Strategy (NCPS) between 2008/09-2013/14Footnote1. Its objectives were to conduct a review in order to document common challenges, examine whether the common challenges differ based upon certain aspects of the project and identify facilitators of successful implementation.
In 2014-15, Public Safety Canada, formerly the research team of the National Crime Prevention Centre, prepared a research contract with the goal of analyzing the issues related to the implementation of evidence-based crime prevention projects in local communities. This work was part of the former National Crime Prevention Centre mandate to build and share the Canadian knowledge base on effective crime prevention programs as well as implementation strategies.
Methodology
Data Sources and Methods
The identification of key implementation data to be collected for the repository (or, in other word, the implementation database) was undertaken in two phases. The first phase involved consultation with the project technical authority (TA) and review of pertinent reference documentsFootnote2 in order to develop a specific questionnaire to collect data from project documents. The scope and type of data recorded in the database was determined in consultation with the TA. The objectives of the consultation phase were to “unpack” the implementation process into discrete elements and to create the basis of a story line specific to each project. The result was the creation of a data collection template (the questionnaire) which contains 200 data fields – both quantitative and qualitative (text-based) fields. The second phase was to pretest the questionnaire with 18 projects. Following this pretest, final revisions were made and some questions were deleted (especially when the level of missing data was too high – these questions were submitted to the TA for future usage – if applicable).
Implementation data collected for this implementation repository was diverse and included information related to project planning and management, services provided, participant involvement, engagement and retention, data handling, and overall implementation challenges and strategies to address them.
With the final questionnaire ready to use, the task of retrospectively extracting data from the 71 project reports was started. The number of documents reviewed for each project ranged between one and five; documents included process evaluation, summary and related reports (for ex. activities reports). The extraction process was carried out in three steps. The first step involved reading the documents in their entirety and recording any data that applied to the questionnaire. The second stage involved looking through the report in sections related to areas defined in the questionnaire. Finally, the “find” function was used to double check for data if it could not be found for specific subject areas.
After the data was entered into the template questionnaire it was then transferred into an inter-relational database (the Survey System) to facilitate data aggregation and analysis for this report. The final database was then transferred from the Survey System into an Excel Spreadsheet for the TA. The contractors also develop a coding manual which accompanied the questionnaire to explain codes and to provide instruction on how to complete the questionnaire. This database has been designed to be used as an ongoing tool for data collection, analysis and evaluation by the TA.
Data Limitations
Some data fields in the repository have a high level of missing data. Reports that were consulted to enter data in the repository did follow templates/guidelines that were developed prior to this study. In other words, the development of the fields in the database was inspired by these templates but some key implementation dimensions, such as sustainability, that were tracked in the implementation database were not part of the templates provided for reporting. This limitation affects the level of missing data, increases the difficulty of the data collection process and highlights areas for revisions to reporting templates/guidelines.
Other limitations also affected the degree of comprehensiveness and accuracy of some of the data. These included the following:
- Variability in the comprehensiveness, quality and specificity of data included in the reports. As mentioned, for some data fields, no data was found in the project documents.
- Incomplete or contradictory data. For example, there were cases when the numbers of participants completing the program varied depending on the report consulted.
- Reports covering different project time periods made it difficult to determine final results.
- Lack of clearly specified information in the reports (e.g., implementation challenges, lessons learned) required some interpretation by the reviewer who completed the template. If reasonable interpretation was not possible, the field was left blank.
- Data constructed retrospectively and not necessarily directly addressing the topics in the repository meant there was frequently no clear consensus on strategies to address implementation challenges.
Where data was contradictory (e.g. number of participants served by the program), the best or most current source of data was used and/or the TA was consulted. If no data was available on a specific item, the data field was left blank or specified as ND (no data) in the repository.
Description of Projects and Services Delivered
Length and Types of Program
The majority of the projects (52%) were from three to less than four years in length; 20% had duration of four years or more, and 28% were funded for less than three years.
In terms of their classification by program type, 24% were classified as model programs, 23% as promising programs, and 54% as innovative programsFootnote3. Just over half (55%) of the projects implemented a program that involved potential contact with the program developer. Although 49% of the projects had no information on this relationship, of those that did, 36% found the relationship to be very helpful, 48% felt that the relationship was somewhat helpful, and 18% felt that the relationship had not been helpful (it should be noted that explanations for these types of relationships were not collected in the database).
Project Locations and Primary Setting
In terms of community size, 52% of the projects were situated in urban locations; 23% in small communities; 17% in primarily rural communities; and 8% in mixed urban/rural areasFootnote4. Eighteen percent (18%) of the projects were located in Northern CanadaFootnote5 and twenty-eight percent (28%) of projects were implemented in isolated or remote locationsFootnote6. Projects included in the repository represented twelve out of thirteen provincial and territorial jurisdictions; and over 20% of the projects were located in Ontario (see Table 1).
| Jurisdiction of Projects | Percentage |
|---|---|
| Ontario | 21% |
| Alberta | 15% |
| Quebec | 13% |
| British Columbia | 11% |
| Saskatchewan | 11% |
| Manitoba | 8% |
| Nova Scotia | 6% |
| Labrador/NFLD | 3% |
| New Brunswick | 3% |
| Northwest Territories | 3% |
| Prince Edward Island | 3% |
| Yukon | 3% |
| Nunavut | 0% |
Fifty-six percent (56%) of the projects were delivered in one setting and 32% were delivered in more than one setting (of those, 7% of the projects had activities that were delivered in more than five settings). In terms of the primary setting for the projects, 32% were delivered within a community/recreation youth facility and 21% were school-based. In a lower proportion, 6% were delivered in social services agencies, 3% were delivered in treatment facilities, and 3% involved residential facilities. Thirty-five percent (35%) were delivered in a variety of settings such as churches, training centres, and in housing developments. It was common for organizations to have multiple delivery settings if they offered diverse activities requiring different types of space, or if they were delivered in several communities.
Services Provided by the Projects
Not surprisingly, all of the projects included in the repository were focused on crime prevention for at-risk populations (children/youth, parents/guardians, adults as a primary at-risk target group). Some projects had additional specific areas of focus, including gang related criminal issues (35%), alcohol/drug related crimes (18%), non-family violence (11%), sexual exploitation (11%), intra-family violence (6%), and bullying (6%).
Projects provided a range of services to their participants. As shown in Table 2, the six most common services were recreational activities (79%), mentoring (77%), counselling, emotional and spiritual support (69%), life skills training (69%), educational services/support/ tutoring/advocacy (59%), and referrals to other services (51%).
| Major Services Provided by the Projects | Percentage of Projects Providing these Services* |
|---|---|
| Recreational activities | 79% |
| Mentoring | 77% |
| Counselling, emotional and spiritual support | 69% |
| Life skills training | 69% |
| Educational services/support/tutoring/advocacy | 59% |
| Referrals to other services | 51% |
| Substance use education or treatment | 49% |
| Parent support/counselling | 48% |
| Individual case planning | 31% |
| Community mobilization | 21% |
| Family therapy | 6% |
| Individual cognitive-behavioural therapy | 6% |
* More than one answer per project is possible.
Service Accessibility
Twenty-eight percent (28%) of the projects for which data was available had challenges in terms of their accessibility to participants. These challenges were consistently higher for projects in isolated or remote locations and somewhat higher for projects in Northern Canada. The most common accessibility issue, identified by 50% of these projects, was a lack of transportation to project sitesFootnote7. Reasons given for this included insufficient budget, no public transportation, or a lack of staff drivers. This was a critical barrier for some participants.
Referrals, Eligibility and Assessment
Of the projects included in the database, schools accounted for the largest volume of referrals (45%) (see Figure 1). For 10% of the projects, the primary referral sources did not contribute to referrals in the ways that were originally expected, meaning that the volume of referrals was lower than expected. In the majority of these cases, the police did not make the volume of expected referrals. In fact, the police were considered the primary source of referrals by only 4% of the projects. No clear reason for this discrepancy in the number of referrals was mentioned in the reports analyzed.
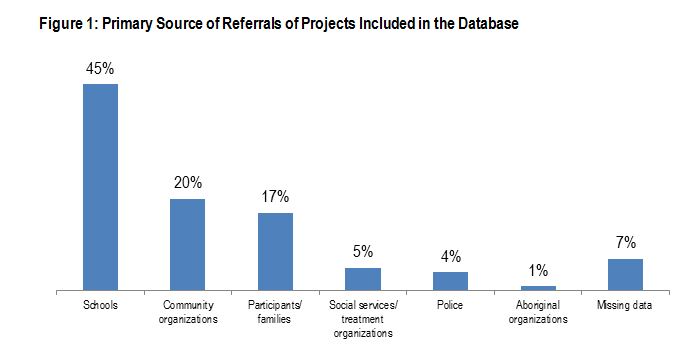
Image Description
It is a bar graph with seven vertical columns which show the primary source of referrals of projects included in the database. From left to right, or from the largest to the smallest, there are schools with 45% of referrals, community organizations with 20%, participants/families with 17%, social services/treatment organizations with 5%, police with 4%, and Aboriginal organizations with 1%. The last column shows the percentage of missing data at 7%.
According to project documents, 69% of the projects had a clear set of eligibility criteria that were used to recruit participants.
Fifty-one percent (51%) of the projects used a risk assessment tool during the referral/recruitment process. A variety of tools were employed and those used by more than one project included the Child Behaviour Checklist, Early Assessment Risk List (EARL- 20B/21G), Child and Adolescent Functional Assessment Scale, and ONSETFootnote8. For over half (58%) of the projects, staff had challenges using the assessment tool. The major challenges were that families and participants found the forms intrusive and were resistant to undergoing the process, or that the length and complexity of the forms made them difficult to complete. Some staff felt that the forms were not that useful in terms of measuring project goals, risks or outcomes and that they were not adapted to specific populations (e.g., gang-involved youth or Aboriginal youth).
The four most common strategiesFootnote9 used to address challenges associated with the assessment forms were:
- replacing the forms with alternatives;
- reducing the number of forms;
- providing incentives to participants to fully complete the forms; and
- establishing relationships of trust so participants were more comfortable of completing the forms.
Projects Focusing on Children and Youth
Characteristics of Children and Youth Participants
Three primary participant groups were defined in the repository: children and youth, parents, and adults; some projects targeted only one primary group (49%), others targeted two primary groups (49%), and finally a small proportion (1%) targeted all three groups. The majority of the projects focused on children and youth as the primary group for their interventions (96%). In addition to intervening with children and youth, 46% also involved parents as a primary group. Finally, 4% of projects targeted only adults.
As illustrated in Figure 2, the majority of the projects focused on youth aged 12 to 17 (57%); and 25% of the projects were targeted to children aged 6 to 11. Concerning gender, the majority of the projects included both males and females (3% focused exclusively on males and 1% focused exclusively on females).
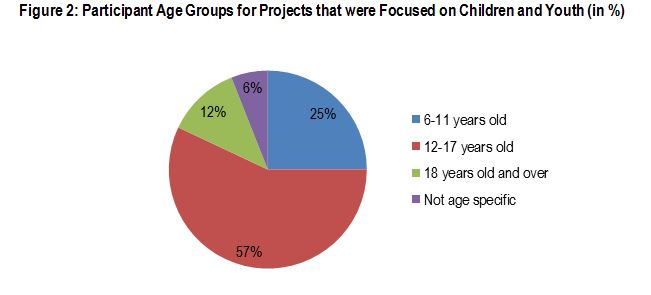
Image Description
It is a pie chart which shows the breakdown of children and youth into four age groups. The first age group, 6-11 years old, represents 25% of participants; the second age group, 12-17 years old, represents 57% of participants (the largest piece of the pie chart); the third age group, 18 years old and over, represents 12%; and finally, the last group is the “not age specific” category, which represents 6%—the smallest piece of the pie chart.
Aboriginal childrenFootnote10 comprised a significant percentage of participants in almost half (47%) of the projects involving children and youth. 28% of the projects identified children and youth as part of an ethno-cultural groups (excluding Aboriginal) and 18% noted that children and youth were part of a minority linguistic group.
Table 3 presents additional data on the characteristics of children and youth involved in the projects. Although some data (risk of offending or re-offending) was available in most of the project documents, data on mental health or drug/alcohol was missing in many cases. Because of the importance of these characteristics for the crime prevention projects, the proportion of missing data were included in the table (in %).Footnote11| Characteristic of Children/Youth Involved in the Projects | Percentage of Projects Indicating Characteristic | No Data |
|---|---|---|
Risk of offending or re-offending |
75% | 9% |
Drug/alcohol related issues |
54% | 26% |
Police contact or criminal records |
54% | 26% |
Mental health issues |
38% | 37% |
Risk of gang-related activity |
26% | 25% |
Other important characteristics of children and youth involved in crime prevention projects were noted by 68% projects. Because data on these characteristics were not systematically reported in project documents, it is likely that they are underestimates. The characteristics that were most frequently described (it is possible to have more than one answer per project) were:
- Poor school engagement (33%);
- Dysfunctional family relationships/neglect and family violence (27%);
- Poverty (23%);
- Aggression, destructiveness/conduct and behavioural problems (23%);
- Problems with peer relationships, social isolation (15%);
- Living in single parent families (10%); and
- Living in foster care/group homes (10%).
Children and Youth Participation Rates
Seventy-three percent (73%) of the projects provided information on the number of children and youth participants. The data provided on expected and actual participation rates for the projects should be treated with caution because some projects had incomplete or inconsistent data on this item. In addition, expected numbers can have limited meaning because they are set prior to activities starting and according to each project's goals, scope and time frame, and sometimes required recalculation over the project life cycle to reflect changes.
The number of expected children and youth participants for the projects ranged from 30 to over 1,000 participants. The average size of the target group for the overall funding period for projects involving children and youth was 330 participants. The average number of participants was 295, suggesting that many projects were slightly under their target projections.
Another perspective is to compare targeted numbers with actual numbers of participants (again, the data should be viewed with caution). By this measure, of the 46 projects that reported both data items, 39% fully met or exceeded their targets, 30% achieved between 75% and 99% of their targets, and 30% achieved less than 75% of their targets.
Recruitment and Retention of Children and Youth in the Projects
Fifty-one percent (51%) of the projects described one or more challenges related to the recruitment of children and youth participants. Common challenges include the following (it is possible to have more than one answer per project):
- Youth resistance to engaging in the projects (26%);
- The length of time it took for recruitment reduced participant rates (12%);
- Reluctance of parents to engage and support the involvement of their children (12%);
- Longer than anticipated project start up periods affected recruitment processes (12%); and
- Intake processes considered intrusive by families or participants (9%) lowered the number of applicants.
To address youth resistance and other challenges related to the recruitment of participants, facilitative strategies were put in place such as: increasing the amount of time dedicated to outreach and engagement; focusing on activities of specific interest to the youth (e.g., recreational or cultural); making home visits; recruiting where participants “hung out” rather than through general publicity; involving previous participants and parents as champions; and building trust concerning the project in the community early in the implementation process.
In terms of strategies to address the amount of time it sometimes took to recruit participants, the projects used recruitment blitzes, more systematic and proactive outreach instead of waiting for referrals, and in one case, changing the location of the project to a different school with potential for a higher level of referrals. Where parents were reluctant to engage, staff made home visits, took more time to explain the program, and devoted more time to engagement by reducing their caseload size. Where the intake process was considered intrusive, the instruments were adapted. In school settings, more time was spent explaining the importance of the recruitment process to teachers.
Concerning challenges associated with children and youth retention, 16% of the projects mentioned the lack of parent engagement or commitment, staff turnover that disrupted participant trust (10%), and about 6% of the projects described challenges such as the complex lives of youth that served to disrupt their attendance, their disinterest in structured activities, being distrustful of the “system”, the difficulty of engaging older youth, transportation difficulties, long intake processes, and youth moving to another community.
Seventy-eight percent (78%) of the projects described the specific strategies they used to maintain their involvement in the project (it is possible to have more than one answer per project):
- 23% said it was important to provide diverse hands-on or recreational activities that children and youth enjoyed;
- 17% of the projects indicated that the quality and trust involved in the staff-participant relationships was critical;
- 13% said that flexible schedules that met the needs of children and youth were important;
- 12% noted the value of adding culturally relevant elements or involving Elders in activities;
- 12% said the provision of free transportation and/or meals was important incentive;
- 10% said it was important to involve youth in decision-making; and
- 10% said that they offered incentives such as prizes or a reward system.
Adaptations Made to Projects Targeting Children and Youth
Fifty-three percent (53%) of the projects designed to reach children and youth made adaptations. Thirteen percent (13%) of these projects added or modified the WraparoundFootnote12 components and 8% added some gender specific classes, changed scheduling to make it more flexible and added more recreational services.
The most frequent adaptation, made in 42% of these projects, was the addition of cultural elements or cultural adaptations to existing elements. This included the addition of culturally appropriate activities such as feasts and ceremonies, the addition of cultural references and elements in the curriculum, the holding of cultural camps, and the involvement of Elders.
Children and Youth Satisfaction
In 96% of projects in which children and youth represented the primary group, 68% assessed their level of satisfaction. Where reported, results indicated that all of the youth participants had a high or moderate level of satisfaction with the project. Fifty-nine percent (59%) of the projects described reasons for participant satisfaction such as:
- Relationships with the project staff (38%);
- Diversity of activities that were offered by the project (33%);
- Appreciation of the friendships with new peers (12%);
- Increase in self-awareness and resiliency (12%);
- The availability of academic support (10%); and
- The help youth participants received to cope with peer pressure, especially in learning to refuse involvement with alcohol and drugs (10%).
Projects Focusing on Parents
Characteristics of Parent Participants
The parents were AboriginalFootnote13 in 26% of the projects and in 27% the parent group was comprised of one or more linguistic minorities (although there was no data on this for 27% of the projects). Linguistic groups appeared to be diverse, consisting of parents from South Asia, Africa, the Caribbean, the Middle East and South America.
Seventy-nine percent (79%) of the projects had information about other important characteristics of the parent participants such as (it is possible to have more than one answer per project):
- 70% of the projects had parents who were dealing with multiple social and economic burdens;
- 54% involved parents described as impoverished;
- 35% were described as having dysfunctional parent/child relationships, including child neglect;
- 27% were heads of lone parent families;
- 23% of the families were newcomer families, often dealing with cultural adaptations or past trauma and violence;
- 23% of parents were dealing with alcohol or drug issues; and
- In 19% of the families there was evidence of family violence.
Parent Participation Rates
Thirty percent (30%) of the projects had data on the expected and actual participation rates of parents. The available data indicated that expected rates for parents averaged 195 participants while actual participation rates averaged 91 participants. Even if this data needs to be interpreted with caution, it reflects concrete difficulties in maintaining parental engagement.
Engagement and Retention of Parents in the Projects
Findings indicate that 45% of the projects had challenges in retaining parents in project activities. Frequently more than one challenge was present in a single project, for example:
- 27% of the projects identified the work pressures and schedules of parents and their general poverty and socio-economic burdens as major reasons for their non-enagement;
- 20% of the projects noted that parents did not want to participate or their children did not want them to participate;
- in 20% of the projects, parents had difficulties with the use of terms like “gang member” for their children, terms they considered stigmatizing;
- in 13% of the projects, parents were concerned that their parenting practices might be criticized in front of others; and
- in another 13%, parents were mistrustful of involvement with non-Aboriginal systems.
Sixty-seven percent (67%) of the projects had information about the strategies they used to try to engage or retain parents in program activities. For almost 30% of the projects, staff engaged parents in their homes, often informally, to build trust. The importance of empathic, communicative staff who sometimes actively advocated for parents was noted in 27% of the projects. In 14% of the projects, changes or adaptations were made to project components to address the scheduling needs of parents, practical help was provided (e.g., transportation and childcare), parents were encouraged to bring their children to meetings and parent information sessions were held. All of these strategies were seen as helpful for retaining parents in project activities.
Parent Satisfaction
In the 46% of projects in which parents were a primary group, 64% of the projects assessed their level of satisfaction. These assessments indicated that 82% of the parents were satisfied with the project (in the other cases the data was too limited to assess). Of the projects that involved parents who were satisfied, 95% had some information on the program components that achieved the most satisfaction (it is possible to have more than one answer per project):
- 50% of the parents were most satisfied with the quality and responsiveness of the staff, describing them as empathic, easy to talk to, high quality and caring;
- 50% of the parents were very satisfied with the information they received on how to parent more effectively and were also most satisfied with the activities that were provided to their children; and
- 15% expressed satisfaction about the access provided to social support and therapy, and the homework assistance and school activities their children were able to access.
Projects Focusing on Adults
Characteristics of Adult Participants
Seven percent (7%) of the projects focused on adults as a primary group. Project documents indicated that some adults in these projects had mental health and alcohol/drug related problems and they were also described as being at-risk of offending or re-offending. The projects were not composed of linguistic minorities; however one of the projects involved different ethno-cultural groups.
There was data on the size of the target groups for only three of the projects involving adults. Target numbers of participants ranged from 60-175 with an average of 103 participants for the overall lifecycle of the project. The projects provided services to an average number of 135 participants, suggesting that they had more participants than originally planned.
Retention of Adults in the Projects
Because the number of projects specifically targeting adults was so small, no clear retention challenges were identified. In one of the projects, participants were court-ordered to attend the program. This resulted in a lack of motivation among some participants and they frequently left the program early. Other issues such as shame, addictions, recurrence of family violence and lack of personal supports were cited as affecting participation.
Two projects had information on the most successful strategies for retaining participants – in one there was strong one-on-one engagement with staff and clear ground rules for project participation. In the other, flexible scheduling helped retain adults in the project.
Adult Satisfaction
In the 7% of projects where adults were a primary group, they completed satisfaction assessments. In 80% of the projects, the satisfaction was high, and one project had no data. The quality of the staff (for example: positive, open, trustworthy and caring) was the aspect these adult participants were most satisfied with.
Project Management, Advisory Group and Volunteers, Project Planning and Issues Related to StaffingFootnote14
Project ManagementFootnote15
Having a leader/coordinator position in the projectFootnote16and the stability of this position and person who play that role through the life cycle of the project is considered an important factor affecting the quality of project implementation. For example, lack of stability at the management level can delay the implementation process and can affect staff's capacities/resources needed to appropriately deliver services/activities. Successful implementation strategies should consider project management as an important variable. As shown in Figure 3, it seems that for 41% projects, there were no major changes at the management level but for 32% of the projects, there are some or frequent changes. However, it should be noted that the level of missing data is high (27%).
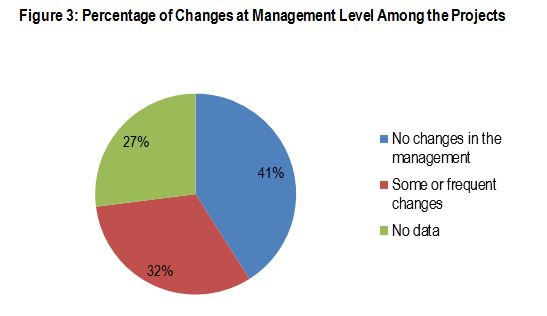
Image Description
It is a pie chart which shows the percentage of changes at the management level broken down into three categories. The first category, no changes in the management, represents 41% of responses and is the largest piece of the pie. The second category, some or frequent changes, represents 32% of responses. Finally, the last category, no data, represents 27% of responses and is the smallest piece of the pie chart.
Sixty-five percent (65%) of the projects documents described challenges associated with project management. The five most frequently mentioned challenges (it is possible to have more than one answer per project) were:
- Staff turnover (33%);
- Management or staff workload (26%) (e.g., over-reliance of staff on the project coordinator; part-time staff for full-time needs; too many administrative tasks);
- Problems with data management including lack of coordination, perceptions of too much paperwork and inadequate databases (11%);
- Poor internal communication within the project (9%); and
- Poor match of staff skills to the requirements of the project (9%).
Projects used a variety of approaches to address these challenges. Staff turnover was addressed by hiring and training replacement staff and defining new roles to maximize the skills of existing staff. In half of the projects with workload stress, due to issues such as too much paperwork, no clear solutions were found. In other cases, more time was given to the project management position or assistance was provided by the advisory committee, partner organizations or the sponsoring agency to help address staff workload or turnover. In some cases, data collection forms were modified or replaced. In other projects certain activities were prioritized or the coordinator was given more time to complete the work. There was limited information available on how internal communication challenges were addressed. In most cases the problems associated with a lack of skills at the management or staff level were resolved by hiring staff with the required skills, so this may also have applied to the lack of communication skills.
The issue of challenges in completing project tasks in the time available was specifically addressed in the implementation database but again, due to the limited amount of information collected through the reporting templates/guides, this area has a high level of missing data (30%) (see Figure 4). For 17% of the projects that answered this question, the challenges were considered major.

Image Description
It is a pie chart which shows the percentage of projects with challenges in completing the work in the time available broken down into four categories. The first category, projects with significant challenges, represents 17% of responses. The second category, projects with occasional challenges, represents 41% of responses and is the largest piece of the pie chart. The third category, projects with no challenges, represents 11% of responses and is the smallest piece of the pie chart. Finally, the last category, no data, represents 30% of responses.
In terms of factors that contributed to the time/work challenges, several were mentioned, including (it is possible to have more than one answer per project):
- Complex needs of the families and youth (24%). Issues such as poverty, single parent homes, family dysfunction, alcohol and drug issues, mental health problems, and cultural integration issues were some of the challenges faced by participants and required more staff time to address them than originally anticipated;
- Lack of experienced staff (21%);
- Data management and evaluation requirements (19%);
- Frequent staff turnover (17%);
- The demands of paperwork and administration – combined with insufficient administrative support (12%); and
- A high demand for the program, which created an increased workload for staff, with particular pressures during intake and follow-up processes (7%).
Various strategies were used by projects to address time/work challenges. In the case of the complex needs of families, the importance of specialized and experienced staff was seen to be the key solution. In one project, psychosocial support was provided to staff to enable them to better handle participant issues and more time was made available to address the needs of clients, sometimes through reducing caseload size. Some projects decided to reduce the number of group activities in order to prioritize one-to-one services. In the case of one project, the overall number of youth targeted by the project was reduced in order to provide for in-depth support where it was required.
Challenges related to project resources (i.e., lack of experienced staff) were not effectively addressed in six of the nine projects where this problem was noted. One project initiated weekly meetings of mentors to discuss ways of maximizing their efforts, and two looked to partners, volunteers or advisory committees for additional resources or adjusted schedules so that other experienced staff could be involved.
Concerning the challenges associated with data management, there was no information on how data workload challenges were resolved in five of the eight projects where this problem was noted. Information collected in the other reports was also limited: for example, in one project, some activities were reduced and in another project, help to complete assessment forms was sought from the sponsoring organization.
The issue of frequent staff turnover was not effectively resolved in four of the seven projects where this problem was noted. For two projects, staff filled in for others, and in another weekly staff meetings were used to clarify the roles and tasks of staff.
Forty-two percent (42%) of the projects described the consequences of time/work challenges and the two most frequent consequences were inability to implement all project components and reduction in services/activities delivered to participants.
Advisory Group and VolunteersFootnote17
A majority of the projects (61%) had an Advisory Group or Steering Committee or Board (for simplicity referred to as an Advisory Group); in 43% of the cases this group appeared to be very active, in 23% of the projects it was somewhat active, and information was not available for 34% of projects. Advisory Group members performed a variety of different functions. The most common types of tasks (it is possible to have more than one answer per project) were:
- Offering advice and guidance to the project on implementation and planning (64%);
- Providing project coordination and oversight (36%);
- Clarifying referral criteria especially with community organizations (21%);
- Partnership building (23%);
- Promoting and championing the project (21%);
- Sustainability planning (13%); and Assistance with monitoring and evaluation (15%).
Two main challenges were related to the Advisory Group (it is possible to have more than one answer per project): the decline in attendance or the lack of engagement over time (53%); and the lack of clarity on the roles, responsibilities and mandate of the group (24%).
Most of the projects (59%) engaged volunteers, although there was no data for 24% of the projects. Volunteers contributed to a variety of activities including organizing and supporting project activities (38%) such as sports, camps or cultural activities. Ten percent (10%) of the projects involved volunteer youth as mentors and 9% involved cultural teachings or guidance, frequently provided by Elders.
Project PlanningFootnote18
The implementation database included data on pre-implementation planning undertaken by the projects and on sustainability planning. Data on these initiatives was missing in many of the project documents; as mentioned previously this information is not collected through the existing reporting templates but researchFootnote19 has shown the importance of the initial phase of implementation, reason why this dimension was kept in the database.
Sixty-one percent (61%) of the projects reviewed current research to plan the program, 1% did not, and for 37% of the projects there was no data on whether or not this had occurred. There were clear indications that a needs assessment prior to program implementation had taken place in 23% of the projects, but in 20% of the projects there was no such assessment. The level of ‘no data' for this question was also high (58%).
In 54% of the projects, there were indications that the project had addressed long-term funding or sustainability issues, whereas 4% of the projects had not done so (and no data for 42% of the projects). Data was collected on the types of efforts that were made by projects to ensure their financial sustainability. Fifty-five percent (55%) of the projects who did sustainability planning provided some detail on the strategies used. For 26% of the projects, a search for future funding was made but no details were given. For 13% of the projects, solid partnership building was seen as a way of ensuring sustainability. Thirteen percent (13%) developed a sustainability committee to address funding issues. For 21% of the projects that did sustainability planning, a community partner took over specific services and in 18% of the projects, government or a large agency provided bridge or temporary funding. Ten percent (10%) of the projects deliberately developed project components that could be continued or replicated in other projects after Public Safety Canada's National Crime Prevention Strategy (NCPS) funding ended. An example of this approach for one project was to build on the training that the project had prioritized throughout the project, so that the training/skills were embedded in the sponsoring agencies and the communities of practice.
Staff Recruitment, Retention and Training Footnote20
ResearchFootnote21 has shown that recruitment of staff with suitable qualifications is a key implementation driver. As shown in Figure 5, the majority of the projects seem to be very or quite successful in recruiting staff with suitable qualifications (42%) although this information was missing for 17% of projectsFootnote22. Nonetheless, it is important to note that 11% of the projects were not successful in recruiting suitable staff. Staff selection and recruitment is the starting point for the establishment of a qualified, experienced workforce to deliver services/activities. Having issues with staff recruitment can have serious negative impacts on the project and can delay its full implementation.
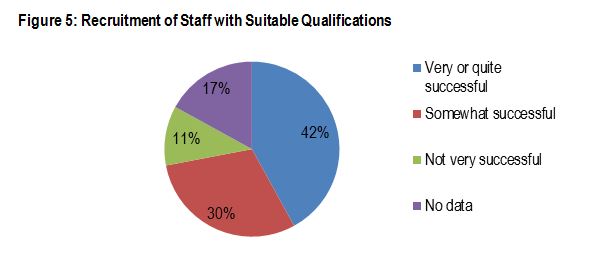
Image Description
It is a pie chart which shows the level of success in recruiting staff with suitable qualifications broken down into four categories. The first category, very or quite successful, represents 42% of responses. It is the largest piece of the pie chart. The second category, somewhat successful, represents 30% of responses. The third category, not very successful, represents 11% of responses. It is the smallest piece of the pie chart. The final category, no data, represents 17% of responses.
Having qualified staff is one thing but retaining them is equally important. As illustrated in Figure 6, it appears that 48% of the projects had challenges in retaining their staff. This information was not available for 25% of the projects.

Image Description
It is a pie chart which shows challenges in retaining staff broken down into three categories. The first category, yes, represents 48% of responses. It is the largest piece of the pie chart. The second category, no, represents 27% of responses. Finally, the last category, no data, represents 25% of responses. It is the smallest piece of the pie chart.
Staff retention challenges had discernible impacts for 35% of the projects. For example, in 28% of these projects difficulties in retaining staff led to reductions in planned activities or project components or slowed down their implementation. For 20% of the projects with challenges in this area, more training was required and this sometimes affected budgets. For another 20% of the projects, the lack of capacity to retain staff meant that it was difficult to sustain trusting relationships with youth which was seen as essential in terms of achieving the goals of the project. In 12% of the projects, staff retention issues were seen as contributing to the sporadic or poor attendance by youth in project activities.
Thirty-five percent (35%) of the projects had some specific information on how staff retention issues were addressed. In over a third of these projects (36%) new staff were hired to replace those who left. Two other main strategies were used: clarification of staff roles and skills needed (18%); and provision of additional or more flexible training (18%).
Finally in terms of staff training, 59% of the projects noted that all their staff participated in the initial training offered by the project; while 6% said this was not the case. However, there was no data on this issue for 35% of the projects. Thirty-four percent (34%) of the projects had information about challenges they encountered with respect to training. The most commonly noted challenge, mentioned for 25% of these projects, was gaps in training content. Although there was no strong consensus in these areas, the training gaps that were described were related to the following: the use of ONSETFootnote23; working with high needs clients; applying positive support strategies to address client resistance or misconduct; self-care; gender issues; and how to carry out risk assessments. For 17% of the projects that identified training challenges, there were problems with some of the staff not receiving all the training, primarily because of staff turnover. In 13% of the projects, there was a problem with the timeliness of the training.
Staff Satisfaction
Forty-two percent (42%) of the projects measured staff satisfaction. In 70% of the cases, staff satisfaction levels were high or moderate; however, in 30% the data was too limited to assess.
Relationships with PartnersFootnote24
Number and Type of Partners
Ninety percent (90%) of the projects reported having at least one partner that contributed to the project. In 10% of cases, the reports did not adequately identify partnersFootnote25. Table 4 indicates the number of project partners involved into the projects and figure 7 illustrates the diversity of partnerships (it is possible to have more than one answer per project).
| Number of Project Partners | Percentage of Projects |
| No data about partners | 10% |
| 1-3 | 17% |
| 4-7 | 11% |
| 8-12 | 27% |
| 13-20 | 18% |
| Over 21 | 17% |
| 100% |
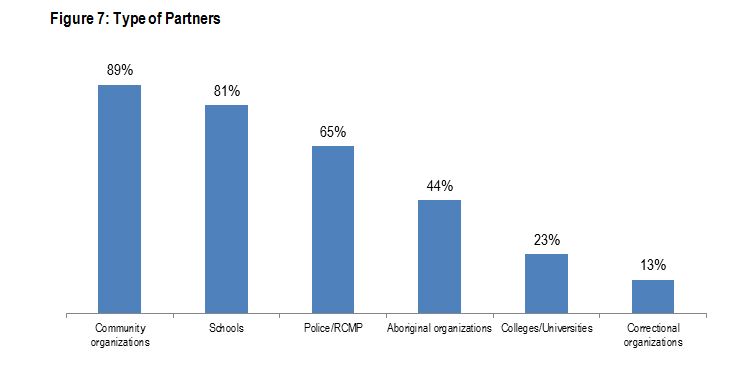
Image Description
It is a bar graph with six vertical columns, which show the principal types of partners. From left to right, or from the largest to the smallest, there are community organizations with 89% of responses; schools with 81%; police/RCMP with 65%; Aboriginal organizations with 44%; colleges/universities with 23%; and correctional organizations with 13% of responses.
Moreover, the implementation database also explored the question of whether or not projects had the feeling that some key partners were missing or not involved in the project. Twenty percent (20%) of the projects lacked relationships with partners that were deemed important. This item had a high percentage of no data (37%) suggesting that it might be an underestimate. There was limited data on the types of organizations that did not become partners. The police/RCMP, intercultural and mental health organizations were noted by several projects as examples of services that would have been valuable partners but these groups had not become involved, and no explanation is given in the reports.
Relationships and Contribution Made by Partners
Community partners made important and diverse contributions to the projects. They were a significant source of referrals, sat on Advisory Groups and provided oversight, promoted the programs in the community, provided sites and facilities, provided funding and other donations, and were frequently involved in some form of project delivery. Contributions made by the specific partner groups are described below.
Relationships with Community Organization
Eighty-nine percent (89%) of the projects had partnership arrangements with community organizations (e.g., community centres, health centres, community social services, local businesses, recreation centres or groups, other non-governmental organizations, etc.). For 75% of the projects, the relationship with community organizations was positive; 11% of the projects said that there were some challenges. The main types of challenges with community organization partners included: limited referrals, lack of mentoring support, less engagement than originally anticipated, and inconsistent ability to provide the planned staffing support. The issue of referrals was a concern because projects were reliant on referrals from these groups in order to achieve their planned participant numbers. Many of these challenges were not resolved, however, in some cases other partners contributed where necessary or the referral form was simplified. Improving communication and networking between the project and partners was identified as important for building strong relationships.
The main contributions made by community organizations to the projects were:
- Providing speakers or trainers for the project (43%);
- Referrals, recruitment and assessment of participants (37%);
- Participation in the project management advisory committee (23%);
- Individual help provided to participants (advocacy, mentoring, work placements, counselling) (23%);
- Provision of facilities (20%);
- Information exchange and knowledge transfer (15%);
- Assistance with program design and implementation (13%);
- Promotion and networking (10%);
- Provision of community benefits as incentives for participants (e.g., free tickets) (10%);
- Financial assistance/donations (7%); and
- Accepting referrals to their own programs in order to provide services to participants (7%).
Relationships with School
Schools were major partners in 81% of the projects. The partnership relationship between projects and schools appeared to be positive in 68% of the cases and involved some challenges in 17% (15% had no data). The major challenges were the reluctance of the school to fully engage (29%), inappropriate referrals at the beginning of the projects (17%), and insufficient referrals or participant recruitment (13%). As noted previously, considerable time was spent explaining the types of students targeted for the program.
Eighty-three percent (83%) of the projects that had information about challenges also had information on how these challenges were addressed. Forty percent (40%) of the projects stressed the importance of establishing trust and positive (i.e., regular) communication with the schools; 10% of the projects found other schools to participate; and in another 10% the clarification of referral criteria and processes helped.
The main contributions made by schools to the projects were:
- Referrals of participants (47%);
- Provision of facilities/site (42%);
- Involvement in the project management advisory committee (16%);
- Involvement in project delivery (14%);
- Participant recruitment and selection (11%);
- Planning assistance (9%); and
- Information and professional advice (9%).
Relationships with Police/RCMP
Sixty-five percent (65%) of the projects had the RCMP or a police service as a major project partner (32% did not identify police as a project partner, or their role was described as minor rather than major). Although 43% of the projects reported positive partnership relationships with the police, 20% said there were challenges. This question also had a high percentage of no data (37%).Projects that had police as a major partner identified a number of challenges with the relationship. In 47% of the projects there was weak engagement with the police. For 29%, there were fewer referrals made by police than originally anticipated. For 18% there was a lack of information exchange and for 12% the police had a different program philosophy from the other partners. The lack of formal information sharing protocols between the police and the other partners also meant that there was a limited ability to provide background information on participants to the projects (12%). In most cases these issues were not resolved.
The main contributions made by police/RCMP to the projects were:
- Referrals, recruitment and assessment of participants (69%);
- Speakers or trainers for participants (62%);
- Program planning, design, coordination, steering committee (35%);
- Promotion of the project (23%);
- Planning and implementation assistance (19%);
- Financial assistance, in-kind donations (19%);
- Information exchange (19%);
- Provision of facilities (12%);
- Security (12%);
- Volunteers/chaperones (12%);
- Event partnering (8%); and
- Provision of criminal incidence data for evaluation (8%).
Relationships with Aboriginal Organization
Forty-four percent (44%) of the projects described relationships with Aboriginal partner organizations. Fifty-two percent (52%) of these relationships were described as positive; in 10% there were some challenges. The percentage of no data for this question was high (35%).
Data on the types of challenges was limited but included a lack of Band support, problems accessing funding, few or inconsistent referrals, inconsistent attendance at events, and communication issues. Most of these issues appeared to be unresolved.
The main contributions made by Aboriginal organizations to the projects were:
- Development of cultural programming and adaptations including Elder involvement (50%);
- Program planning and design assistance as well as being on advisory committees (35%);
- Speakers or trainers for sessions (35%);
- Provision of facilities (35%);
- Referrals, recruitment and assessment of participants (19%);
- Volunteering in general (19%);
- Provision of transportation (15%);
- Financial assistance/donations (15%);
- Provision of equipment and supplies (12%);
- Information exchange (8%); and
- Help for individual participants, usually as a mentor or buddy, or by providing an opportunity to develop a skill (8%).
Relationships with College/University
Twenty-three percent (23%) of the projects had colleges or universities as partners. In 56% of these projects the relationships were positive. No challenges were identified in these relationships, but 44% of the project documents had no data on this question.
Relationships with Correctional Organization
Thirteen percent (13%) of the projects had relationships with correctional or justice facilities. There was no data on the quality of the relationship for six of the nine projects. In one case the relationship was positive, and two projects reported some challenges. These included: court-ordered clients required continuous supervision; problems with the consistency of referrals; and irregular attendance of the correctional/justice facilities member on the Advisory Group. These issues were not resolved.
The major contribution of correctional organizations was providing referrals to the projects (89%) and 33% of the correctional partners participated on a project management committee and provided advice.
Engaging and Motivating Partners
Thirty-nine percent (39%) of the projects had information on the challenges of engaging partners. The most common challenge, documented for 25% of the projects, was the time required to network and communicate sufficiently to maintain the interest of partners; 11% of the projects also said that partner organizations were often too busy to become involved.
Thirty-one percent (31%) of the projects had suggestions for motivating partners to participate. The majority of these projects (68%) emphasized the importance of regular communication with partner groups and several mentioned the importance of in-person communication. Involving partner organizations on the Advisory Group was noted for 23% of the projects, and active involvement in planning or project activities was noted by 27%.
Partner Satisfaction
In 46% of the projects, partner satisfaction was measured. In 68% of those cases satisfaction was described as moderate or high, but in 32% the data was too limited to assess satisfaction.
Project Fidelity and Adaptations
A majority (60%) of the projects made some adaptations from the original program, and in 6% many adaptations were madeFootnote26. Adaptations reflected the needs of individual projects and were highly variable. The most common adaptations involved dropping or reducing some elements of the projects (15%). For example, in one case leadership training for youth was dropped. Adding cultural elements was noted in 17% of the projects and the addition of components or activities was noted in 15%. Other adaptations involved adding more information on gender oppression, changing the type and order of assessments, having fewer sessions, changing content to reflect Canadian perspectives and changing the data collection tools.
The primary reasons for adaptations to the projects stemmed from project challenges. This involved needing to increase the engagement of and build trust with child/youth participants (34%), address the problems of parent involvement (16%), and add meaningful cultural content that wasn't included in the crime prevention programs (11%). Adaptations were made to the content of the projects because of a lack of resources and service capacity for 16% of the projects – this sometimes involved reducing activity.
Thirty-nine percent (39%) of the projects indicated that there were aspects of implementation that limited the delivery of effective services to clients. The main issue was the lack of key staff or staff turnover (20%) which led to disruptions in programs and limiting the delivery of some activities. Sites which reduced the number of activities that could be offered were described in 11% of the cases as was the lack of effective strategies to reach parents and the difficulties of addressing the complex problems of youth, including the need for more employment-related activities for older youth no longer in school.
Data Management Issues
Over two-thirds (69%) of the projects had challenges managing data collection or the reporting of dataFootnote27. Half of these projects had some detail on the types of challenges they faced. The most common issue was the perceived high level of demands on staff for project documentation and the collection of data (52%). Forty percent (40%) of the projects had problems with duplicative, inconsistent and incomplete data and 36% had difficulties engaging participants in the data collection process. Twenty-eight percent (28%) of the projects had problems defining what data collection expectations were, the timing for data collection and who should do it. Sixteen percent (16%) had difficulties with understanding and using the electronic systems designed to manage and store the data. Twenty-four percent (24%) of the projects didn't appear to collect much data and there were large data gaps, for example a lack of basic data on participants.
In 32% of the projects, data challenges were not fully resolved. The most frequent strategies were to simplify, stop or reduce the use of specific forms (12%), to start using new and improved software programs (15%), or to ask for help from the evaluator to assist with data collection and management. Nine percent (9%) of the projects also received help from the sponsoring organization, or developed clear guidelines on what was to be collected and who should collect it.
Most Significant Implementation Challenges and the Strategies Used to Address Them
Extensive data was extracted from the project documents to provide summary information on the implementation issues that were the most challenging for the projectsFootnote28. The data was analyzed to determine the broad areas of implementation that were considered most challenging. Because of the diversity of responses, data were aggregated and overall themes, even if they were sometimes difficult to identify, were developed. Examples of the issues that appeared to be the most challenging are noted in Table 5. Issues were included in the table if at least 5% of the projects made reference to them.
Most challenges have been described in previous sections of the report under more specific topic headings, for example, challenges related to youth retention in the projects. These sections offer more detail on these challenges compare to the summary table.
The overall results from the analysis of the implementation challenges indicates that data management issues (42%), recruitment and referrals of participants (42%), partnership building and maintenance (38%), management and administrative issues (37%), program content (35%), staff turnover (34%), participant engagement (31%), and planning (30%) were the most challenging implementation issues and were noted in over a third of the projects.
In addition to these challenges, the column “examples of common strategies” provides a summary of the main approaches the projects used to deal with the specific challenge. They are not presented as being inherently positive or negative strategies. Indeed there was generally no long-term follow-up assessment of the efficacy of the strategies or adaptations that were made.
Broad Areas |
Percentage of Projects |
Specific Challenges | Examples of Common Strategies |
|---|---|---|---|
| Data management | 42% | Too many forms, onerous, inappropriate or incomplete data instruments | Simplification/reduction of forms, sponsoring organization or evaluator assisted |
| Recruitment and referrals of participants | 42% | Unable to reach target numbers, difficulties recruiting youth (especially if not in school), difficulties reaching specific target groups (e.g., girls, gang-involved youth) | More promotion and outreach, opened up criteria, built in cultural activities, opened up eligibility, revised target numbers |
| Partnership building and maintenance | 38% | Lack of sustained meetings, did not understand the program, low engagement of the police, limited understanding on how to connect effectively with First Nations organizations, need for access to other professional groups (e.g., mental health) | Improved and regular communication and networking with partners |
| Management and administrative issues | 37% | Lack of staff, lack of administrative support, lack of case managers | New hiring |
| Program content | 35% | Lack of cultural focus, lack of process for transitioning out, lack of job/employment options for youth, lack of programming for girls, limited adherence to the program content | Added employment preparation course for youth, cultural adaptations |
| Adequacy of the overall number of staff / staff turnover | 34% | High staff turnover | Replaced staff, changed roles in organization |
| Participant engagement | 31% | Difficulty retaining, poor attendance, no participation in leadership activities | Made programs more flexible, lessened attendance requirements, focused on interests, identified target participants early so they are not put in another type of program and so they can be engaged quickly and appropriately |
| Planning | 30% | Lack of planning time, lack of consensus on program approach or activities, difficulties meeting school schedules | Slower pace of admissions to create more planning time, changed length of sessions at schools, regular staff meetings |
| Participant needs | 28% | Complex and long-term participant needs, diversity of groups (usually in relation to age and/or gender) | Targeted interventions, more one to one counselling, referrals to intensive services, lower staff to client ratio |
| Parent engagement | 27% | Not engaged, poor attendance, distrustful | Outreach in homes, allowed parents to attend activities with children, building empathy and trust relationships with staff, new activities that interested parents |
| Staff hiring and qualifications | 23% | Lack of candidates with qualifications, poor fit of staff with project (e.g., staff could not think developmentally or establish rapport with youth) | Broadened recruitment area, relaxed qualifications, expanded outreach within project area |
| Accessibility issues | 18% | Transportation to facilities or sites (lack of resources for vehicles or to pay drivers) | Projects provided free transportation |
| Funding and resources | 18% | Financial uncertainty/limitations, lack of resources for some activities | Found additional funding, reduced some activities |
| Facilities and sites | 15% | Insufficient settings, lack of meeting places | Secured new setting, locations |
| Staff training | 14% | Insufficient staff training, lack of time for professional development | Supervisor spent more time with staff, sponsor provided training, mentorship provided |
Most Common Strategies of Project Implementation
Although all projects encountered some implementation challenges, there were many examples of strategies and approaches that were employed to address the challenges (see Table 6). Those used most frequently includedFootnote29 building strong relationships through sustained communication and networking (45%); offering diverse activities that were appropriate and interesting to youth (31%); incorporating cultural teachings in materials where applicable (21%); developing the project systematically (21%); having staff who could connect well with youth (21%); and having experienced and qualified staff allowing projects to deliver with professionalism (21%). Participants such as mothers valued the attention paid by the staff to the challenges they were facing in their lives.
| General Area | Most Common Strategies of Project Implementation | Percentage of Projects Reporting |
|---|---|---|
| Program content and structure | Diversity of activities, age and gender appropriate, activities interesting to participants | 31% |
| Aboriginal cultural activities, teachings and Elder involvement | 21% | |
| Individual mentoring from staff, volunteers, peer leaders | 17% | |
| Small group sessions that support learning | 10% | |
| Employment training and related activities for youth | 7% | |
| Building community outreach and mobilization strategies | 7% | |
| Building collaboration in schools, including the teaching of a common language or terminology that students could use with other students and with teachers to express feelings constructively and effectively | 6% | |
| Project development | Systematic development with clear focus, careful monitoring, reliable delivery (e.g., materials presented in consistent manner) | 21% |
| Availability of local facilities and equipment | 7% | |
| Provision of transportation | 6% | |
| Including meals | 6% | |
| Organization and staff | Workers connect well with youth | 21% |
| Highly committed, experienced and professional staff | 20% | |
| Flexible staff, able to adapt delivery (e.g., to comprehension level, reading ability of students) | 17% | |
| Strong advisory or planning group | 17% | |
| Experienced sponsoring organization and strong management, good communication and support | 17% | |
| Support of program developer, good training and coaching | 13% | |
| Participants involvement | Strong outreach with families, home-based treatment, resolution of family problems | 20% |
| Good research to identify appropriate participants (e.g., with FASD) | 7% | |
| Incentives to retain youth, youth feedback put into activities, locating where participants are to prevent absenteeism from the program | 7% | |
| Partnership/ network building |
Strong collaboration, communication and relationships with partners | 45% |
| Effective data management including referral forms, handling of assessments so information is transmitted between partners effectively | 7% |
Lessons Learned of Project Implementation
Many of the project reports had information about the lessons learned or best practices they had identified in relation to successful project implementation. Information in these reports was diverse and highly qualitative in nature.Footnote30 The results, as shown in Table 7, were clustered by themes.
| Response Category | Percentage of Projects Reporting |
|---|---|
| A. DEVELOPMENT OF PROGRAM | |
|
30% |
|
24% |
|
11% |
|
10% |
|
10% |
|
4% |
|
4% |
|
4% |
|
4% |
| B. ENGAGING, WORKING WITH PRIMARY GROUPS | |
|
30% |
|
20% |
|
18% |
|
15% |
|
10% |
|
6% |
| C. SPONSOR ORGANIZATION AND STAFF | |
|
28% |
|
15% |
|
14% |
|
6% |
|
6% |
|
6% |
| D. PARTNERS | |
|
24% |
|
24% |
|
15% |
|
6% |
| E. EVALUATION | |
|
15% |
|
7% |
|
8% |
Key Conclusions
Data collected for the implementation database was gathered retrospectively from a range of project documents which varied in comprehensiveness and the degree to which they addressed implementation challenges. Some issues were not explicitly stated as challenges although they were expressed as concerns or barriers to achieving effectiveness. There was no process in place to confirm the accuracy of the data and for some data fields, the level of missing data was high. Despite these limitations, key implementation challenges were identified for all of the projects.
Data management was a challenge for many of the projects. Projects identified issues related to employing multiple forms, extensive data collection requirements, problems with software and difficulties completing data collection instruments. This was in a context where staff lacked data management skills or felt that documentation detracted from direct service delivery. Projects addressed this by simplifying and reducing forms, if appropriate, and getting extra help from the sponsoring agency or the project evaluator. Risk assessment tools required by some of the programs also posed problems for some organizations because staff lacked a complete understanding on how to complete them. In these cases, contact with the program developer was sought and in most cases this was perceived as helpful.
Recruiting youth and parents was challenging for many of the projects. Some specific groups such as girls or gang-involved youth were also identified as being difficult to recruit. This was related to the complex needs of the families in addition to the fact that older youth were disengaged from the mainstream helping system and school. A number of projects stressed that it is critical to enlist parent support in order to recruit children and youth. Although not mentioned by a large number of projects, some noted that parents were particularly concerned by language that stigmatized their children such as “gang-related”. In some cases projects over-estimated their target group and their ability to attract participants in a very challenging environment.
Common approaches used to address these challenges included more promotion of the project for specific groups like girls, opening up eligibility requirements, revising target numbers and building trust in the community at the beginning stages of the project. Building trust was contingent on the quality of the staff which both the parents and children/youth perceived as high. Another key strategy was providing activities that were attractive to youth (sports, recreational and experiential) and to their parents (practical parenting information). Projects also found it useful to discuss potential project involvement with participants outside of a formal office setting and in the home or where youth congregated.
Reliance on partnerships was a key component of all the projects. Partners made many essential contributions such as providing settings and facilities, making referrals, participating in project activities, providing cultural mentoring and guidance through their involvement on Advisory Groups. While relationships with partners were generally positive, it was difficult to sustain their involvement over time. There were also disappointments in terms of the level of referrals from some partners such as the police and Aboriginal organizations. There was also a need to include more intercultural and mental health organizations in partnerships. Projects stated the importance of on-going personal communication to partners as a way of keeping them engaged. Giving partners opportunities to participate in decision-making through the Advisory Group was also seen as an effective approach.
Staff turnover was a challenge for many of the projects and had direct implications in terms of their ability to offer all of the project components. Contributing factors to high staff turnover were the high level of staff skill requirements, which could not always be met, and the isolated or remote location of some of the projects. Hiring replacement staff and/or shifting positions internally were the two key ways this issue was addressed. Staff turnover also had implications for training. Staff hired later in the implementation process did not always receive the full training protocol. Providing training later also had budget implications. Insufficient training was usually compensated by providing internal mentoring by senior staff. However, some projects felt they staff would have benefited by on-going staff upgrading or training.
Challenges concerning the hiring of staff were a related issue. For some projects there was a lack of qualified candidates in the area and a poor fit of staff with clients. In these cases, projects broadened their scope of recruitment and accepted different types of qualifications.
Program content was a challenge for some of the projects, particularly in relation to specific groups like girls, older youth, or Aboriginal participants. In the case of girls, there was more focus on activities they preferred like role plays. For Aboriginal youth, efforts were made by many of the projects to include cultural elements in the curricula or to include mentoring by Elders and exposure to Aboriginal ceremonies and teachings. Projects that dealt with older youth had challenges providing employment related options, something youth were interested in. Follow-up with older youth was also challenging. With the exception of the latter, most projects addressed these challenges by adapting project components. In one case, community partners helped provide funding to pay youth for participating in employment preparation positions.
Participant needs were complex and families were dealing with multiple issues. To address these concerns projects sometimes focused on more targeted interventions delivered on a one-to-one basis or reduced caseload sizes. In general, it appeared that older youth were better served when counselling, mentoring and support were offered one-to-one.
Some of the projects had challenges related to planning including a lack of planning time, difficulties establishing protocols with the schools and police, and working according to the original program. Key approaches to address this included allowing more time for planning, prioritizing communication with the schools to trouble-shoot planning issues, and having regular staff meetings to discuss the planning process.
Most projects were seen as highly accessible to clients. For some projects, the lack of access to free and available transportation became a barrier to participant involvement. In isolated or remote communities reliable transportation was essential because of the lack of public transportation available. In all cases, projects resolved this by adding this as a budget item, using volunteers or obtaining/using a van.
Some projects had challenges with funding and resources and many found it challenging to plan for sustainability. In some cases, budget items were reassigned or donors contributed to project components. Sustainability planning was not well described in most of the project documents and most projects did not appear to be able to obtain post-project funding. That being said, many projects had elements that likely contributed to long-term changes in their communities such as training for facilitators or school personnel.
It is evident from the project documents that despite clear data limitations the majority of the projects were systematically planned and implemented. They faced expected challenges in providing services to high need children/youth and families within a relatively short time-frame and within budget. Implementing projects in isolated or remote communities was particularly challenging. The impression from program documents was that projects were well attuned to their participants and able to be flexible in understanding their needs in order to engage them more effectively. The one area where there were more critical problems was in the engagement of parents which was disappointing to many of the projects.
Building on the information gathered through this study will assist crime prevention practitioners and policy makers in their understanding of common implementation challenges associated with implementing crime prevention programs. Furthermore, the Implementation Guide developed by research analysts from Public Safety CanadaFootnote31 should be used as a companion guide to be informed about best practices in the implementation science domain as well as to refer to the checklists to ensure effective strategies when implementing crime prevention programs.
Appendix A: Definitions of Crime Prevention Program Types
In 2008-09, the National Crime Prevention Centre (NCPC) began providing, through a grants and contributions agreement program, multi-year funding for “model, promising, and innovative” crime prevention programs addressing known risk factors for populations at high risk of becoming or staying involved in criminal behaviour. These terms were derived from the US, where in 1999, the US Office of Juvenile Justice and Delinquency Prevention (OJJDP), in collaboration with the Substance Abuse and Mental Health Service Association's (SAMHSA) Center for Substance Abuse Prevention (CSAP), conducted a search for “model” family-focused programs for the prevention of delinquency and substance abuse. The programs are rated and divided into categories based on the degree, quality and outcomes of research associated with them.
Definitions of these categories are as followsFootnote32:
Model Program:
Prevention programs that meet the highest scientific standard for effectiveness (scientifically proven prevention and intervention programs), as evidenced in published evaluations; have a significant, sustained preventive or deterrent effect or reduction of problem behaviour, the reduction of risk factors related to problem behaviour; or the enhancement of protective factors related to problem behaviour and have been replicated in different communities or settings.
Promising Program:
Prevention programs that meet scientific standards for effectiveness; but they do not meet all of the rigorous standards of Model programs. They are recognized and encouraged with the caution that they be carefully evaluated. In general, when implemented with minimal fidelity these programs demonstrate promising (perhaps inconsistent) empirical findings using a reasonable conceptual framework and a limited evaluation design (single group pre- post-test).
Innovative Program:
Prevention programs that test new approaches and theories to interventions with at-risk populations. They are based on a strong theoretical framework that links the proposed intervention to the risk factor(s), target population and desired outcomes. Innovative projects show demonstrated changes through limited research design and require causal confirmation using more appropriate experimental techniques. These programs are recognized and encouraged with the caution that they be carefully evaluated.
Footnotes
- 1
These projects, pre-selected by the project technical authority, were included in the implementation database and form the basis of this report. Technical Authority for this project was represented by employees from Public Safety Canada, formerly the National Crime Prevention Center.
- 2
Internal templates/guides/matrices in evaluation and performance monitoring were consulted as well as the Implementation Guide (Savignac & Dunbar, 2014) in order to identify the most relevant implementation indicators for which data needs to be collected.
- 3
See Appendix A for definitions of “model”, “promising”, and “innovative” programs. Examples of model programs include: Life Skills Training (LST) (7%); Multi-systemic Therapy (MST) (3%); Stop Now and Plan (SNAP®) (11%); and Project Towards No Drug Abuse (TND) (1%). Examples of promising programs include: Leadership and Resiliency Program (LRP) (1%); Project Venture (4%); Youth Inclusion Program (YIP) (7%); Wraparound (4%); Alternative Suspension (1%); Pathways to Education (1%); Reconnecting Youth (1%); and Gang Prevention through Targeted Outreach (1%).
- 4
The definition of community size did not have a strict population descriptor and needs more refinement. Typical “urban communities” included all provincial capitals and in most cases exceeded 30,000 inhabitants. “Small communities” were communities with roughly 5,000-30,000 inhabitants (e.g., Burns Lake, BC). “Primarily rural communities” generally referred to small communities. “Mixed urban/rural areas” generally referred to projects that operated in a region or numerous communities rather than a single community.
- 5
Northern Canada included not only projects in the two territories, but also in the northern part of the non-maritime provinces.
- 6
“Isolated or remote location” projects frequently were the same as “Northern Canada” projects, but also included some southern projects (Peguis First Nation; Merritt) that were not closely connected to other communities, or to which access was difficult.
- 7
Other less frequent issues related to accessibility were social in nature. For example, many parents were distrustful of the school system because of their residential school experiences. For these parents, accessing a project located in the school involved overcoming a significant psychological barrier. This might not be possible for some parents without major outreach by the program to parents in their homes or in a neutral setting. Similarly, the complexity of the lives of some families and youth made regular attendance at a program impossible, effectively limiting their capacity to access programs with high attendance requirements.
- 8
For more information about screening and risk assessment tools, consult this publication: www.publicsafety.gc.ca/cnt/rsrcs/pblctns/tls-dntf-rsk-rprt/index-en.aspx
- 9
Strategies presented in this report are not classified as being inherently positive or negative strategies. Indeed there was generally no long-term follow-up assessment of the efficacy of the strategies or adaptations that were made.
- 10
For the purposes of the database, a project was classified has having Aboriginal participants when 50% or more participants were Aboriginal.
- 11
Information about the number of primary participants with a history of offending, the number of primary participants with substance abuse issues and the number of participants with diagnosed mental health issues, conduct disorders, neurobehavioral disorders, and fetal alcohol spectrum disorders is normally available in other internal project reports. Because of the volume and specificity of this type of data, such reports were not part of the review for the development of the database.
- 12
The Wraparound approach refers to an intensive, individualized care management process for youth with serious, complex needs. It places the young person at the centre of his/her care planning. Adaptations made were about modifying the levels of intensity around frequency, inclusion of relevant parties, and length of the process.
- 13
For the purposes of the database, a project was classified has having Aboriginal participants when 50% or more the participants were Aboriginal.
- 14
Results presented in this section need to be interpreted with caution. In the templates/guides provided to the external evaluators, there was no obligation to evaluate and describe the following subjects: project management, advisory committee, project planning, and staffing. As a result, data associated with the challenges as well as the strategies are certainly underestimated. Because of this limitation, implementation topics covered in this section present high level of missing data.
- 15
Data collected in the implementation database to address the project management included: consistency of the leader/coordinator through the life of the project; the most challenging issues in terms of program management and how these challenges were addressed; challenges completing tasks in the time available; factors contributing to time/work challenges; how challenges were addressed; and how these challenges impacted the project.
- 16
Project documents described the person leading the project as a coordinator in 44% of the projects, as manager (27%) as supervisor (10%) and as director or by other titles in 15% (e.g., site facilitator, “intervenant-pivot”, commanding officer, youth community animator).
- 17
Data collected in the implementation database included: presence/absence of an Advisory Group/Steering Committee/Board in the project; how active was this group; the most significant contribution made by this group and the most issues/challenges associated with the functioning of this group.
- 18
Data collected in the implementation database associated with project planning included: needs/organizational assessment completed prior the initial program implementation; access current research to plan the project; and planning the sustainability of the project.
- 19
Savignac, J., & Dunbar, L. (2014). Guide on the implementation of evidence-based programs: What do we know so far? Ottawa, ON: Public Safety Canada. Available from: http://www.publicsafety.gc.ca/cnt/rsrcs/pblctns/gd-mplmnttn-vdnc-prgrms/index-en.aspx
- 20
Data collected in the implementation database included: how successful the project was in recruiting staff with suitable qualifications; initial training and challenges associated with training; challenges in retaining staff; how these challenges were addressed; and what impacts they had on the project.
- 21
See Savignac, J. & Dunbar, L. (2014)
- 22
Fifty-six percent (56%) of the projects had specific information on the background or qualifications of their staff and from those: the main qualifications were in the fields of social work counselling, education, mental health and addictions (60%); staff with experience working with the project target groups including high risk youth, families or immigrant populations (45%); staff with specific leadership skill training (10%); and staff with specific cultural competency training (8%).
- 23
ONSET is the screening and risk assessment tool employed in the Youth Inclusion Program (YIP).
- 24
Information presented in this section is again limited to what the reports chose to cover and questions asked in the Public Safety Canada templates. In the final process evaluation report, information is provided about the number and type of community partnerships and about any positive or negative results from the partnerships. For example, questions included in the original process evaluation template were as follow: Were project staff able to work effectively with partner organizations? Was the project able to coordinate well with partner organizations? In the Performance Monitoring Report template, information provided concerns which partners the organization has worked with during the reporting period (bi-annual report) and details are given on the type of contribution and the sector of the organization. Questions in the implementation database were built upon these original questions and a decision was made to collect as much data as possible specifically for each partner (for example, school, community organizations, police, etc.). Information extracted in the consulted reports varies considerably in terms of quality and quantity – this is why some partnerships are well-described compared to others.
- 25
This result was discussed with the TA and needs to be interpreted with caution. All projects are required to have partners – maybe this result is due to a misunderstanding of the reporting requirement.
- 26
Categorization of the extent of adaptations was a subjective assessment by the reviewers who compiled the repository. The recording categories were “no major adaptations made”, “some adaptations made”, “many adaptations made” and “no data”.
- 27
Data collected in the implementation database associated with the data management issues included: did the project have any challenges in data collection and/or reporting and how were these challenges addressed?
- 28
Data collected in the implementation database were on the five significant implementation challenges faced by the project and the strategies used to overcome them.
- 29
Data collected in the implementation database were on the five strategies of program implementation that were used most frequently.
- 30
Data collected in the implementation database were on the five lessons that were learned from this project that may contribute to effective crime prevention programming in the future.
- 31
See Savignac, J., & Dunbar, L. (2014)
- 32
National Crime Prevention Centre (2008). Promising and Model Crime Prevention Programs. Public Safety Canada, Ottawa. Available from: http://www.publicsafety.gc.ca/cnt/rsrcs/pblctns/prmsng-mdl-vlm1/index-en.aspx
- Date modified: